The featured maps for this year's Esri Map Book are out of this world. A stunning portrayal of a lunar crater, submitted by Chris and Roland Behee, was selected for the cover of Volume 18: Geography and GIS—Serving Our World.
The maps of the Tycho crater were a collaborative effort by the two brothers who share an interest in astronomy. Although this project was undertaken on their own time, both brothers are also GIS professionals. Chris is a GIS analyst for the Planning Department of the city of Bellingham, Washington, and Roland is a GIS program coordinator with Community Transit in Everett, Washington.
The Tycho maps incorporated orbital photographic images taken as part of the Deep Space Probe Science Experiment (DSPSE), commonly known as the Clementine mission, and remotely sensed topography data obtained from earth-based radio telescopes.
The Clementine mission, jointly sponsored by the Ballistic Missile Defense Organization of the United States Department of Defense and the National Aeronautics and Space Administration (NASA), began with the launch of the Clementine spacecraft aboard a Titan IIG rocket from Vandenberg Air Force Base in California on January 25, 1994. Clementine produced imagery of the entire moon's surface using near-infrared (NIR), far-infrared (LWIR), ultraviolet-visible (UV-VIS), and high-resolution (HIRES) sensors that yielded 10 to 100 times better resolution than sensors previously used.
During several data gathering efforts in 1997, lunar topographic data of unprecedented accuracy was captured by the Deep Space Network (DSN) using interferometry. A 70-meter radio telescope and several 34-meter stations at DSN's communications facility at Goldstone in the Mojave desert in California were used together to bounce radar signals off the surface of the moon. By using the stations together, the spatial resolution of the data is equal to data gathered by an instrument with a diameter equal to the physical separation of the instruments on the ground (i.e., many miles).
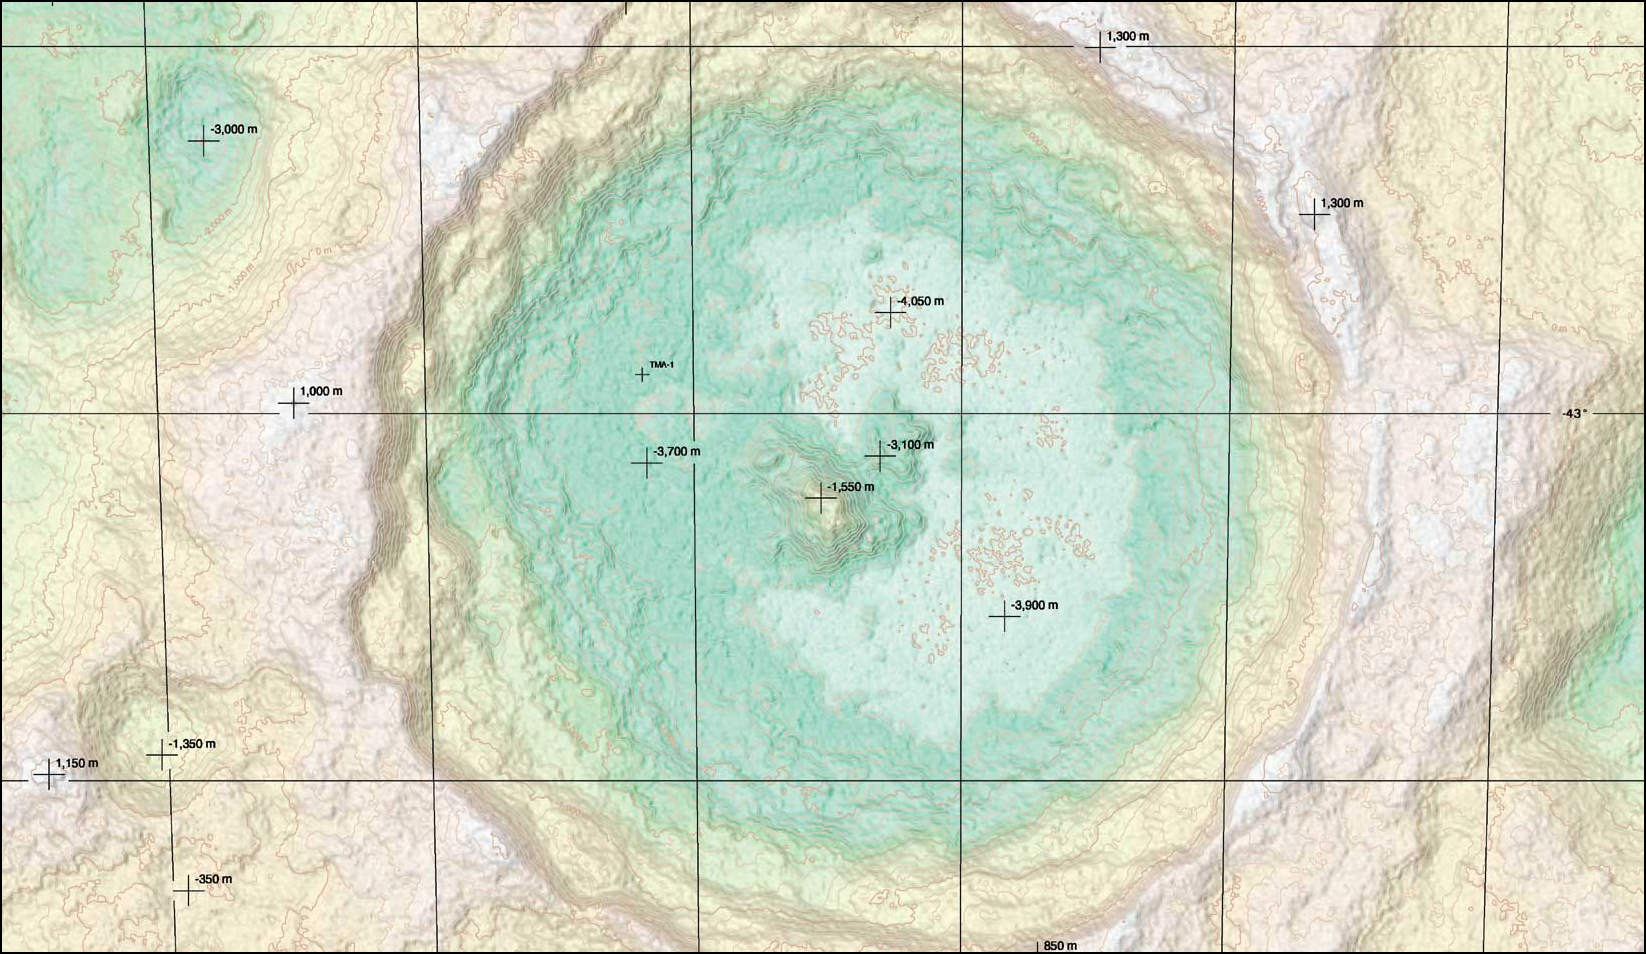
The observations produced high-resolution radar imagery of the moon's polar regions as well as a 200- by 200-kilometer region surrounding Tycho. A portion of this area was portrayed in the maps. Processing the radar data resulted in a digital elevation model with 150-meter horizontal and 50-meter vertical resolution.
Radar-derived digital elevation data was acquired in Planetary Data System (PDS) image format. Using ArcGIS 8.1.2, the image was converted to a GRID file in a Sinusoidal projection with a spherical radius of 1,748 kilometers. The elevation data has a vertical resolution of approximately 50 meters and a cell size (or horizontal spacing) of 150 meters.
Topographic shading was achieved using a multidirectional hillshade algorithm weighted with an aspect image toward an illumination source at azimuth 293 degrees and an altitude of 50 degrees. Elevation ranges were then fused with the hillshade to create a relief map of the Tycho crater.
An orthographic scene was created using the triangulated irregular network (TIN) surface modeling tools in ArcInfo Workstation, and a false-color Clementine orthophoto was draped over a portion of the radar-derived elevation model. A vertical exaggeration factor of 2.5 was used to generate the wireframe (or mesh) surface. The full 150-meter resolution was used to define the surface for draping, while 500-meter spacing was used for the mesh area.
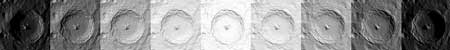
A series of images was created that show Tycho elevation data through nine stages of illumination. The frames simulate, from right to left, the illumination of the crater from waxing gibbous through full and waning gibbous phases showing 11 days of the 28-day lunar cycle. Topographic shading for the images was achieved using the GRID hillshade command in ArcInfo Workstation with the ALL option. This option shades for both local incident illumination angles and projected shadows from intervening terrain. Shading areas in shadow as pure black simulates the sharp-edged character of illumination on a planetary body with no atmosphere. The sequence of phases was achieved by varying illumination azimuth and angle. The final printed map was generated using a Hewlett–Packard Designjet 755 CM.
For more information, contact
Chris Behee, GIS Analyst
City of Bellingham, Planning Department
City Hall
210 Lottie Street
Bellingham, Washington 98225
Tel.: 360-676-6982
Fax: 360-738-7306
E-mail: cbehee@cob.org
or
Roland Behee, GIS Program Coordinator
Community Transit
7100 Hardeson Road
Everett, Washington 98203
Tel.: 425-348-7100
E-mail: roland.behee@commtrans.org