ArcUser Online
Exploring Food Environments
Assessing access to nutritious food
By Karen Richardson, Esri Writer

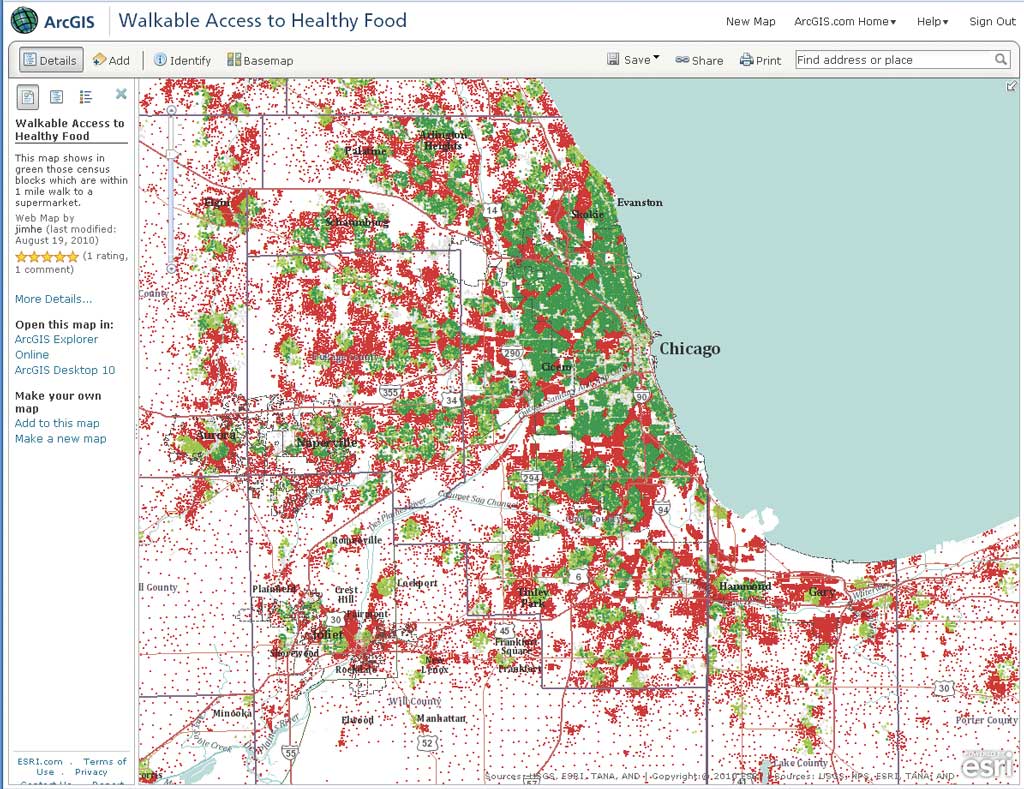
This map answers the question, How many residents in this neighborhood live within a walkable distance of a supermarket? for several areas of Cincinnati, Ohio. Green dots represent populations living within one mile of a supermarket. Red dots indicate populations living in areas that require more than a one-mile walk to a supermarket.
This article as a PDF.
"GIS has a lot to contribute to discussions about how people access food, recreation, and other human needs," according to Jim Herries, a product engineer for cartography at Esri who has been working on mapping access to healthy foods.
Because diet has a direct effect on health, people who eat nutritious foods have a lower propensity for diabetes, obesity, and other diseases and chronic conditions. If access to nutritious food is limited or made difficult by factors such as cost or the distance traveled to obtain it, a population can be adversely affected. Areas that lack relatively easy access to nutritious, affordable food have been described as "food deserts."
"It's a very useful thing to draw a map of where people are and the types of food available around them. You look at that map and wonder, are people getting what they need?" said Herries. "Esri decided to look into ways that GIS could help people look a little deeper to see how things differ from neighborhood to neighborhood. And we'd like to do this in a way that is relatable to the existing studies in literature and provides an opportunity for communities to improve the quality of life for the people who live there."
Early attempts at mapping the food environment used geography aggregated at high levels and simple methods for measuring access to food. "The question is, is this really an accurate representation of what is out there?" said Herries. "One thing I know for sure is that we can use GIS technology and data to define distance a bit better than what we've seen historically."
Instead of measuring distances as simple rings or "as the crow flies," GIS can look at distance over a road network. It determines how many people live within the prescribed distance of the grocery store based on travel over streets. Using actual street network topology more accurately models time and distance and produces more reliable results. Even the best optimization algorithms will generate grossly inaccurate results if the underlying time and distance measurements are not correct.
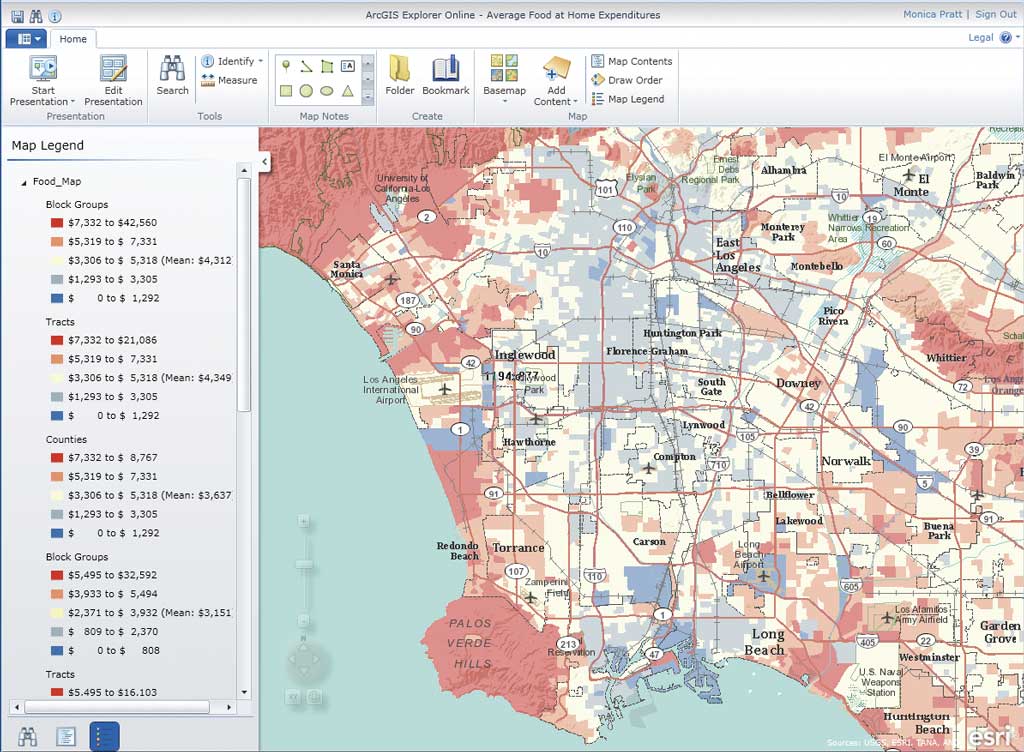
This map of Southern California, displayed in ArcGIS Explorer Online, shows average annual household expenditures on food consumption at home based on the Consumer Expenditure Survey.
How Would a Crow Walk (or Drive)?
Herries' analysis used a logical network that incorporated information about the topology of the network so that overpasses, underpasses, one-way streets, speed limits, and turn restriction conditions could be accurately modeled. To assess the food environment of an area, Herries generated an origin-destination (O-D) matrix that provided the cost (in time or distance) associated with travel from one location to another. In this case, the cost was the time required to drive or walk from the shopper's location to the nearest grocery store. Street data that included attributes for speed limits, one-way streets, and barriers was combined with starting and ending locations to generate an accurate O-D matrix.
The travel time computed by applying a shortest-path algorithm to a street network dataset realistically models the characteristics of the route traveled and avoids unrealistic scenarios like driving across water bodies or through areas with no roads.
Moving Analysis to a Useful Scale
Historically, many studies of food access have used census tract-level population data because this is a convenient geographic unit. However, census tracts have an average population of 43,000—hardly the size of a typical neighborhood. Smaller geographic units are available: census block groups and census blocks. On average, block groups contain 1,500 people, and blocks contain 40 people. A block group is the smallest geographic unit for which the U.S. Census Bureau publishes sample data. Major retailers use block group and block data in GIS analyses of markets, sites, and competitors.
Instead of using census tracts, Herries looked at block data. He looked at how many grocery stores existed within a 10-minute walk of each one of the eight million census blocks in the United States. The results were summarized at the block group level to show the minimum distance to the nearest store and the number of stores within a 10-minute travel time, whether walking or driving. The results of this analysis made the borders of food deserts obvious. For example, at the block data level, it is clear that freeways are a barrier for people walking to a grocery store from a population center.
The Healthy Food Access Score
Herries, along with a team of Esri staff members, developed a score that could be used to evaluate the food environment for an area. They had noticed a trend in food desert research that made a lot of sense: researchers rated, or scored, each census tract based on criteria to define the boundaries of food deserts.
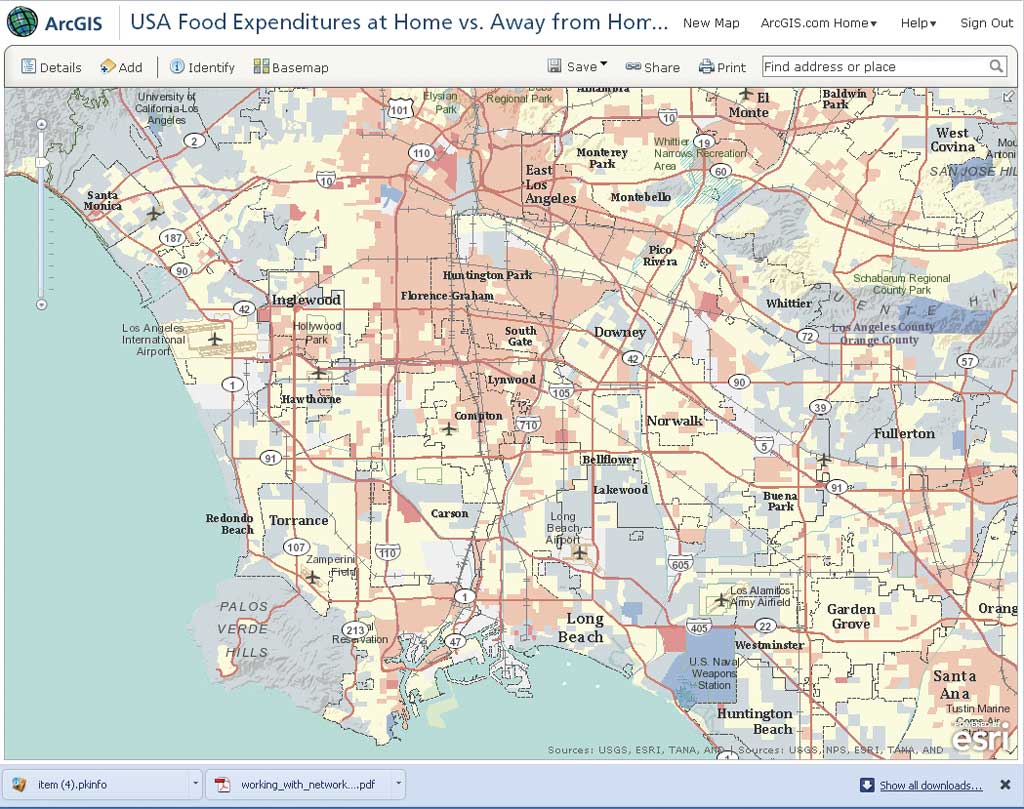
The ratio of dollars spent on food at home (groceries) versus dollars spent away from home (restaurants) is symbolized for the same area of Southern California.
Recognizing that defining what "good food" is and is not had broad implications, the Esri team started with two basic questions about accessibility: How many supermarkets are accessible by people on foot? and How many supermarkets are accessible by people by car? The supermarket walk score represented the number of supermarkets that were within a one-mile walking distance. The supermarket drive score represented the supermarkets that were within a 10-minute drive. The health access score is a blend of these two scores, factoring in additional demographic information relating to households living in poverty and households without a vehicle. The criteria are consistent with previous studies, but the data used is more accurate and the technology applied more advanced. The Healthy Food Access Score incorporated analysis of eight million census blocks, the road network for the United States, and 26,000 grocery stores that had annual revenues of $1 million or more.
This scoring approach is flexible because walking and driving parameters can be adjusted up or down. "It's all about where you draw the line," said Herries. "Someone ambitious could even set up a distance or drive-time parameter for every store in the analysis, which is what many retailers do."
Opportunity in Adversity
Herries determined that approximately 80 percent of the households in the United States have good access to healthy food. Conversely, 20 percent of U.S. households have poor access to good food. Based on this criteria, there are 23 million households (or approximately 62 million people) that are underserved. Food deserts are not just an urban problem. Thirteen percent of the nation's more than 3,100 counties qualified as food deserts. According to a 2007 study done by Lois Wright Morton, who studies rural communities at Iowa State University, and Troy Blandhard, a Louisiana State University sociology professor, food desert counties are common from Montana to North Dakota and continue along a band that stretches south to the western half of Texas.
According to the grocery industry, a grocery store needs 30,000 square feet for every 10,000 people to maintain profitability. Herries' data shows a significant business opportunity in this industry. For underserved rural populations to obtain good food access, new grocery stores will need to be built or existing grocery stores remodeled. Policies such as the Healthy Food Financing Initiative may help bring grocery stores and other healthy food retailers to underserved communities, both rural and urban.
The food deserts group on ArcGIS.com (www.arcgis.com) was started for anyone interested in studying food deserts and their relation to other topics, such as poverty, obesity, and other health concerns. Visitors can view maps on food access and expenditures.
Putting Data to Work
Dr. Angela Odoms-Young, an assistant professor of kinesiology and nutrition at the University of Illinois, Chicago, stresses that investigating food deserts should be used to improve the food environments in these areas, not chalk up another negative mark against particular neighborhoods. "As a researcher, if a food desert is something policy makers hear and they want to do something about, I'm in support of it, but as a community member, it's another negative thing about the place where I live. It's not the need that brings in the resources; there's got to be an and. There's a need, and there's an economic opportunity."
The business community agrees. "It's time for action," said Alan Hunt, senior policy associate at the Wallace Center at Winrock International. "What is needed is a set of coordinated, community-based activities across the country, including outreach to existing corner stores, incentives for locating new retail stores, public transportation improvements, farmers' market development, nutrition education, and other activities to improve food access." The Wallace Center is a national nonprofit that supports entrepreneurs and communities in building a food system that is healthier for people, the environment, and the economy.
Food access data is particularly relevant, as many large retailers and grocery store chains analyze where to locate new stores in the same way. Edens & Avant, which owns, operates, and develops community-oriented shopping centers throughout the East Coast, aligns the best mix of retailers (e.g., Fresh Market, Whole Foods, and Publix) with neighborhood needs and market opportunities using GIS and geographically referenced demographic information.
Continuing the Discussion
Herries started the Food Deserts group on Esri's ArcGIS.com (www.arcgis.com) for anyone interested in studying food deserts and their relationship to other topics such as poverty, obesity, and other health concerns. (The ArcGIS.com Web site allows anyone to create maps, find and use maps, use Web mapping applications, and share maps and applications published by Esri and the ArcGIS community.) Herries has placed the Healthy Food Access Score and other related maps on the site.
About the Author
Karen Richardson has been at Esri for almost 18 years, serving in various capacities in sales and marketing. She is currently a writer in the marketing communications department, specializing in the use of GIS in commercial business and the map, data, chart production, and spatial data infrastructure (SDI) communities. She edits the Esri newsletters BusinessGeoInfo, Compass Points, and Smart Facilities.