ArcUser Online
Assessing the Accuracy of Small Area Forecasts
Ground truth project validates housing data with ArcGIS
By Douglas A. Skuta, Economist; Jim Herries, Product Engineer; and Earl A. Nordstrand, Manager, Esri Data Development Team
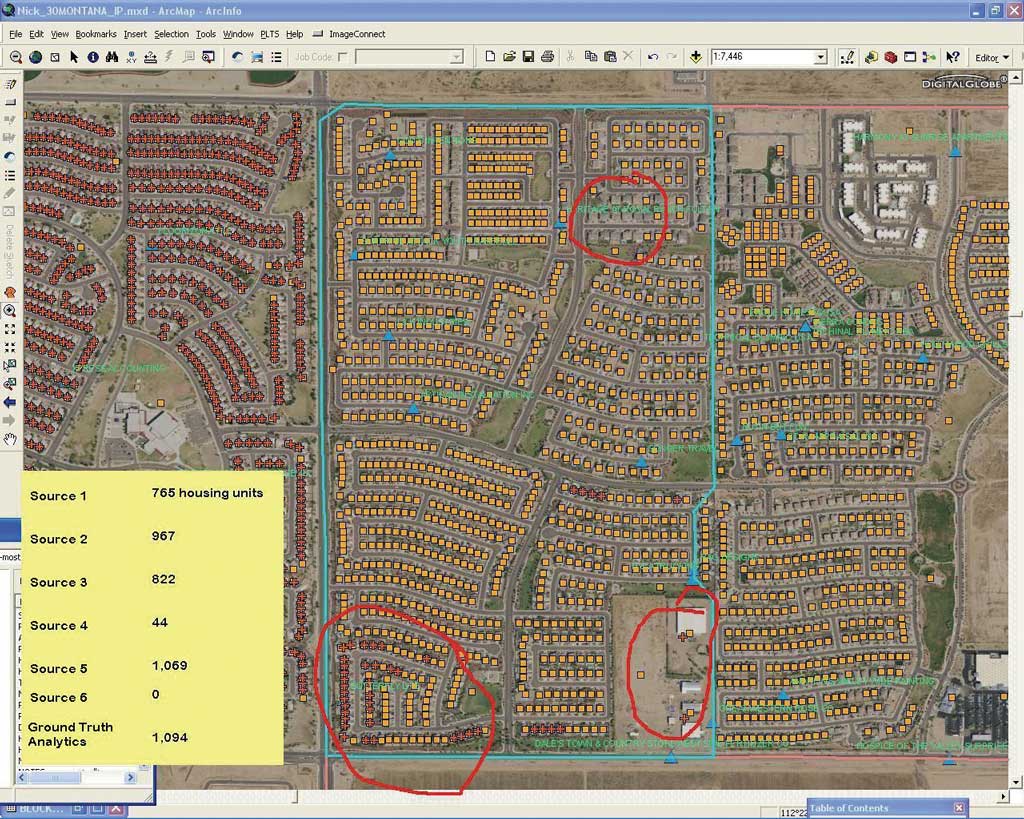
This review screen for a block illustrates how ancillary data, such as address points, can highlight development in many blocks. The red outlines identify areas where two different sources of address points vary in coverage.
This article as a PDF.
Esri undertook an innovative project that produced valuable insights into its modeling process and validated the accuracy of its housing unit estimates at a small area level (block group) using ground truth information gained by manually comparing data sources with aerial imagery.
Although the decennial census provides block-level counts of population and housing units along with basic demographic traits every 10 years, data users prefer more current information. Unfortunately, current data is not reported for small census areas such as census blocks or census block groups. [A census block is the lowest level of tabulated census geography. Census blocks are assembled into block groups.] This data is provided for postal areas (carrier routes or nine-digit ZIP Codes), larger areas such as places or counties, or the smallest unit possible—addresses.
Calculating a segue from areas with current data to the smallest census areas has always been challenging because the boundaries for these areas do not correspond. Why not use the addresses as a direct measure of the population distribution? Because address lists are flawed: they include duplicate listings, incomplete address information, group quarters, nonresidential address listings, and a lot of post office boxes. Postal databases also include errors. Even census counts require review and correction. While it is incumbent on data providers to reconcile the differences among the many data sources that enable current information, that is easier said than done.
In 2005, Esri developed a method called Address Based Allocation (ABA) to assign current data from postal areas to census blocks using addresses. ABA uses the actual locations of mail deliveries and solves the complex challenge of converting delivery counts from carrier routes to block groups. [For more information on ABA, see "The Secret Life of Polygons: Understanding the relative accuracy of user-defined areas" by Douglas Skuta and Lynn Wombold in the summer 2008 issue of ArcUser and the Esri white paper, Esri Demographic Update Methodology: 2010�2015.] However, the basic question remained: how to verify delivery statistics from the U.S. Postal Service, national household databases, national business databases, housing development databases, and changes in street networks and parcel databases without taking a census. Advances in navigational databases and street images—along with the ready availability of satellite imagery—could help if the analyst could find a way to integrate the disparate data sources and automate this validity check. Esri applied its own technology and GIS tools to do just that and enabled a ground truth check of its current demographic data.
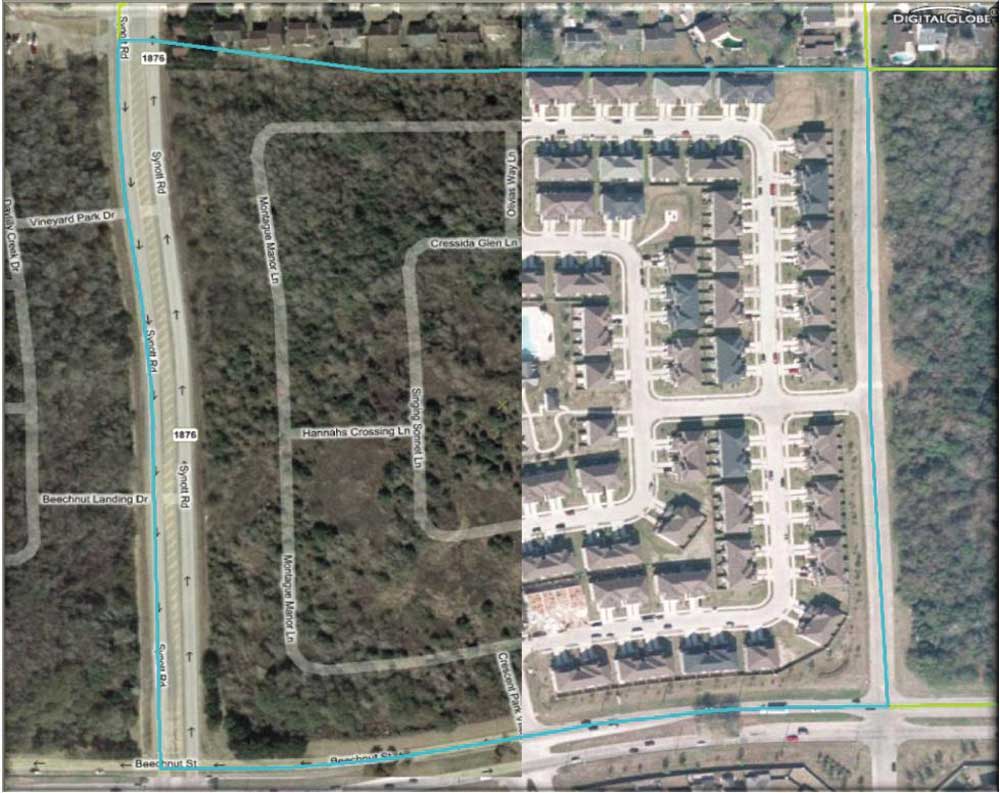
Two images, taken at different times, were spliced together. The newer image provides evidence of residential development and enabled a straightforward comparison of current and alternate estimates.
From Concept to Completion
Over the past decade, Esri's data development team has employed Esri technology and a variety of databases to check any anomalies found in a data source (e.g., a sudden drop or increase in a time series) or respond to data users' questions about specific sites. Ground truth, or a visual image of a site, can quickly dispel any questions on local housing development. Internal tools have been developed to help Esri staff quickly find an area of interest, such as a block or block group, and overlay geographic attributes (e.g., boundaries, centroids, and attribute data) on various imagery data sources.
Prior to developing the 2010 demographic updates, Esri staff decided to apply those verification tools on a much larger scale to check the source data that would supply the 2010 housing unit totals for subcounty areas. Accordingly, a proprietary data collection interface was developed in Esri Business Analyst. In fall 2009, temporary staff was hired to confirm the accuracy of source data using the software to manually review selected small areas. Esri's data analysts worked with geographers to define a project to test the data. Internally, this project was dubbed the ground truth project.
The project sample frame included the universe of all 208,687 U.S. block groups, including over 8.2 million blocks. Block groups were not selected randomly. Instead, they were chosen based on either discrepancies in source data or the magnitude of change in the area since 2000. Nearly 5,800 block groups were flagged for inspection during the project's two-month time frame. Visual confirmation took place at the lowest level of census geography, the block. Given the number of blocks in the selected block groups, blocks were also prioritized based on the size of the differences in source data. Blocks with the largest discrepancies were given top priority and placed at the top of the queue.
Project Software and Data
The project used ArcGIS 9.3.1 with the Business Analyst desktop extension. With advanced analytic and visualization tools and comprehensive geographic and demographic data, ArcGIS was well suited to overlay census geography on various aerial imagery sources to assess change over time. Address lists, address points, business data, and other comprehensive data sources were incorporated. Access to several imagery sources was also a requirement. ArcGIS could easily integrate many kinds of data:
- Census boundaries and centroids
- Street basemaps
- Bing Maps aerial imagery with street labels from ArcGIS Online
- DigitalGlobe imagery via Business Analyst's ImageConnect toolbar for ArcGIS
- i-cubed imagery from ArcGIS Online
- Four sources of block-level housing unit estimates
A customizable graphical user interface (GUI) tool was developed in Visual Basic for Applications (VBA) using ArcMap as the portal for facilitating data collection. The tool allowed users to cursor through the selected blocks. The input boxes and drop-down lists allowed analysts to perform each task in the workflow, including adding supporting attribute data for the block. The simple VBA form enabled more efficient data entry and allowed fewer chances for errors like accidentally skipping valuable attribute collection. The input boxes and drop-down lists not only simplified research but also helped prevent the entry of inappropriate values.
Because an ArcSDE-enabled geodatabase was used, multiple users could access a single feature class, which allowed rapid analysis of the data and the performance of data management tasks. At the end of each workday, the database was sorted for unique values, which identified data entry anomalies. A daily sort also provided a count of the number of records per analyst. This determined the rate of data entry per analyst and helped in assigning each analyst to regions that best fit that analyst's skills. The entry form and multiuser environment combined to facilitate the well-organized, efficient analysis of the blocks under review.
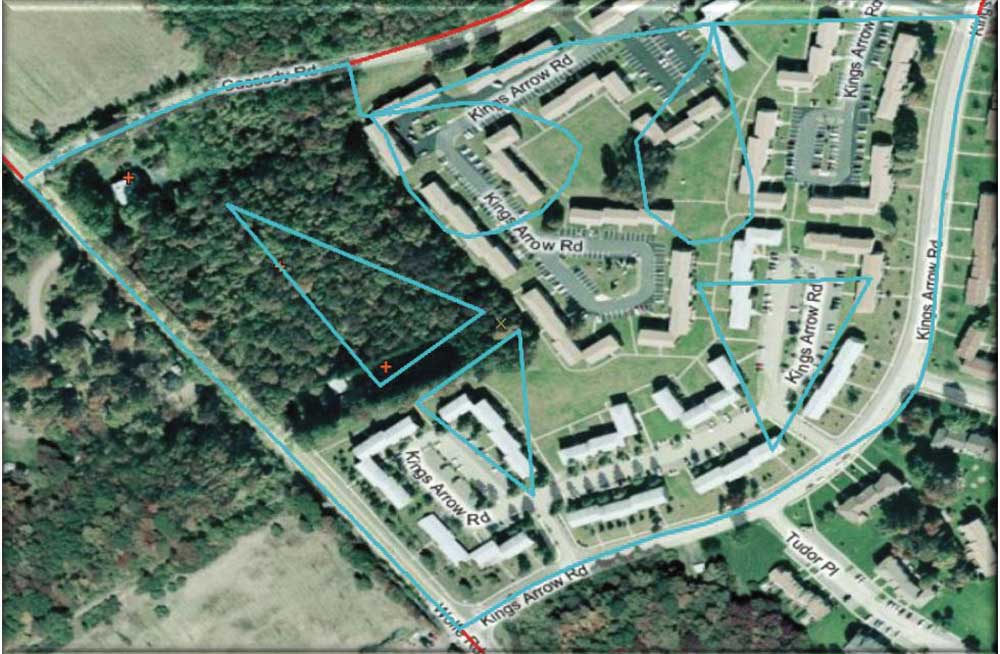
Not every block review was straightforward. This example demonstrates the difficulties encountered when the block boundaries and satellite images were not cleanly aligned.
Another application, created to complement and enhance the productivity and accuracy of the visual review, allowed the reviewer to click on an area and choose either Google's Street View or Microsoft Bing Maps Bird's Eye tool to get an online, oblique view of an area without leaving the application. This Visual Basic script, assigned to a tool and added to the toolbar, automatically initiates a Web browser, inputs the URL link to the online imagery service, and provides the coordinates so that the user can inspect the area using detailed imagery from these sources.
The Review Team
This visual review was performed by a team of 13 temporary employees. Half the team worked full-time, and the balance worked part-time schedules. After the team members underwent an orientation to learn software and data procedures, they were also taught many tips and techniques to increase efficiency and enhance workflow volumes.
After reviewing each block with respect to the satellite image overlays, reviewers chose one of four possible outcomes:
- The residential structure count matched the 2009 housing estimate.
- The residential structure count did not match the 2009 housingestimate.
- The block boundaries were misaligned with the structures within the imagery, preventing a confirmation count.
- The block could not be visually inspected due to issues with the satellite imagery (e.g., date of image not current, tree or cloud coverage masking structures, poor image resolution).
Reviewers were asked to supply additional information about the block such as housing type (single family, mobile home, or multiunit structure), the presence of a new development, or the amount of developable land area remaining for future housing growth. Reviewers chose from among a predefined set of responses for each characteristic but could add notes in a comments field.
Project Evolution and Highlights
The project leader actively monitored the team from start to finish. This enabled developers to focus on quickly adapting applications to enhance their efficiency. Team feedback led to changes that resulted in a more robust GUI. The GUI was adjusted numerous times over the course of the project to improve productivity and ease of use, particularly by enabling the reviewers to input data with a minimal number of clicks.
Rapid prototyping helped the team fine-tune the methodology, input data, application, and training to suit the areas being analyzed. During the early phases of the project, the Production Line Tool Set (PLTS) extension [now known as Esri Production Mapping] was used to prototype efficient workflows for block analysis. ArcGIS, with its customizable interface, allowed numerous refinements over the course of the project. Quality assurance was monitored each week. Some reviewers were able to modify code to streamline their own workflows, tripling throughput from 25 to 75 blocks reviewed per hour. These productivity gains allowed the project's total block review goal to be met sooner than expected, and more blocks were reviewed than had originally been planned for the project.

This block has limited population growth potential. Block boundaries were not always defined in a manner that represented the distribution of the population.
Another unexpected benefit of this manual review process was the team's ability to adapt quickly to housing units unique to different areas (e.g., shotgun duplexes in New Orleans, retirement communities on golf courses, or mobile home parks). The rate at which features were analyzed increased every day of the project, and the quality of the information was monitored daily to ensure consistent application of counting and reporting procedures.
Conclusion
In the end, the team reviewed 2,596 block groups, or 112,033 blocks, in the time allotted for the project. Although this is only a fraction of the total of 208,000 block groups, the selection process focused on neighborhoods with the most significant change in the past decade. This excluded more than 90 percent of the block groups. Less than 9 percent of all block groups display a change of �2.5 percent yearly. Thanks to the GUI and feedback from the review staff, the initial project milestone was reached ahead of schedule and below budget estimates. Ultimately, the team was twice as productive as had originally been estimated.
By combining multiple authoritative sources of information on the map, the team was able to identify areas of agreement quickly among those sources. Given the project's purpose—assessing demographic data sources—just identifying disagreement among the sources furnished useful information. Most important, the project provided ground truth confirmation and improved the accuracy of Esri's 2010/2015 forecasts. For more information, contact Douglas Skuta at dskuta@esri.com.
About the Authors
Douglas A. Skuta joined Esri in 2000 and has more than 10 years of analytic experience in statistical programming and econometric methods. He contributes to the development and updating of Esri's demographic databases and consumer segmentation systems and also works on custom site selection and profiling projects for Esri's retail and real estate clients. Prior to joining Esri, he served as an economist in the branch of Development and Applications Research for the Current Employment Statistics Survey at the U.S. Bureau of Labor Statistics in Washington, D.C. Skuta holds a bachelor of arts degree in economics from Hillsdale College in Hillsdale, Michigan, and a master's degree in economics from Ohio University in Athens, Ohio.
Jim Herries is a geographer with 15 years' experience defining and delivering solutions involving GIS and demographic data. As a product engineer on the cartography team at Esri, he supports multiple teams seeking to put information about people, housing, and businesses into their services, products, and solutions. Herries earned his master's degree in geography from Ohio State University in Columbus, Ohio, and his bachelor's degree in journalism from Lindenwood College in St. Charles, Missouri.
Earl A. Nordstrand joined Esri in 1988 and has more than 30 years of analytic experience in geography and GIS. Currently managing the Business Analyst product team, he has also managed Esri data products, worked in the technical marketing of ArcGIS software, and developed custom GIS solutions. Prior to joining Esri, he managed the North Slope Borough GIS, was research director for the Minnesota Land Management Information Center, and was the director of information systems for the Arrowhead Regional Development Commission. Nordstrand holds a bachelor of science degree in geography from the University of Minnesota, Duluth, and a master's degree in geography from the University of Minnesota.