ArcUser
Fall 2012 Edition
Information through a Map Lens
Solutions that embrace the cloud and consumption-based models
This article as a PDF.

Chris Ovens, Esri director of location analytics business
Esri writer Karen Richardson sat down with members of Esri's newly formed location analytics team, Chris Ovens, Esri's director of location analytics business, and James Killick, the Esri product management lead for location analytics. The team focuses on geoenabling and geoenriching data that is stored in enterprise systems such as business intelligence (BI), customer relationship management (CRM), enterprise resource management (ERM), and Microsoft Office. Solutions currently developed by this team include the ArcGIS Business Analyst suite of products, Esri Maps for Microsoft Office, and Esri Maps for IBM Cognos.
Richardson: How would you define location analytics?
Killick: Location analytics is one of the next big waves for the business analytics space. Location as a part of business analytics has always been relevant—most commonly for things like site analysis and customer intelligence applications—but it's been overlooked for too long. With the mass adoption of smartphones and location-aware applications, the amount of location-based data is exploding, and people are more and more accustomed to looking at the information through a map lens.

James Killick, Esri product management lead for location analytics
This adoption is making a big impact in the business arena. People are more comfortable with viewing data on a map, and when they see patterns, they want to understand them—that's location analytics. And this is a good thing, since location analytics gives you the ability to see your data in a whole new way that graphs, charts, and tables can't reveal. Simply being able to interact with your data through mapping enables you to find and understand patterns that weren't obvious in tables or charts. For example, where are your sales concentrated? Or where are geographic features like mountains, rivers, or freeways having an effect on your business or your organization? Where do you have gaps in coverage? Where should you be allocating more resources?
Although this is a very useful and valuable exercise, simply mapping your data is not the whole story. It's when you start to leverage spatial analytics that things start to get more interesting. One very simple yet immensely powerful form of spatial analytics is to tie the data in the map to your graphs and charts. As you drill down into the data, the charts and graphs update to reflect what you are seeing, or as you drill down into the charts and graphs, the map updates. For many people there are lots of "aha" moments, when they suddenly figure out the answer to a question that has bugged them for a long time. Seeing data on a map for the first time really brings that data to life. It's interesting to see just how much people want to explore and understand what those patterns mean.
But it can go much, much further than this. Imagine you needed to ascertain the true trade area of a store because of competition or cannibalization. With location analytics, you can answer a question like, Where exactly do 80 percent of our revenues come from? Or perhaps find out which customers are within a specific drive time of a location. With location analytics, you can use your table, chart, and map data to do new analysis. You can model how much business you would generate at one location versus another as well as quantify the effect a new location would have on your existing locations. Let's say you need to determine how many sites you need to open to cover 80 percent of the market and maximize revenues. Obviously you want to find the locations for those sites. Can you do that with traditional analytics? All of this is possible with the kind of location analytics that Esri's platform provides.
So location analytics is really about three key things: It's about dynamic, interactive mapping. It's about sophisticated spatial analytics. And it's about rich, complementary data that can be used to enhance the overall picture of your market. Used together, you can get better understanding and knowledge so you can make the best decisions.
Ovens: A very popular business book was released in 2007 called Competing on Analytics: The New Science of Winning. The big idea in this book was that organizations could harness their data for competitive advantage. Arguably, this book contributed to the growth of the business analytics movement, where investment in IT systems has been pervasive—even through the recent economic downturn. By and large, however, the location or geographic perspective has been missing from these systems. Location analytics is the complementary addition of spatial capabilities—mapping visualization, spatial analytics, and information enrichment—to these important information systems.
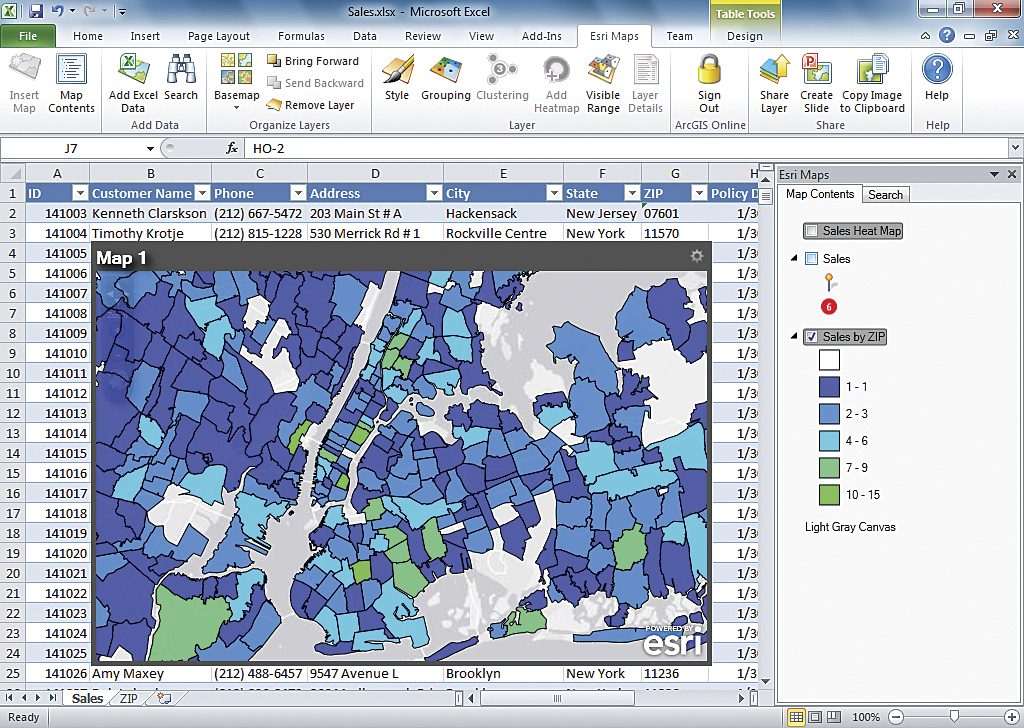
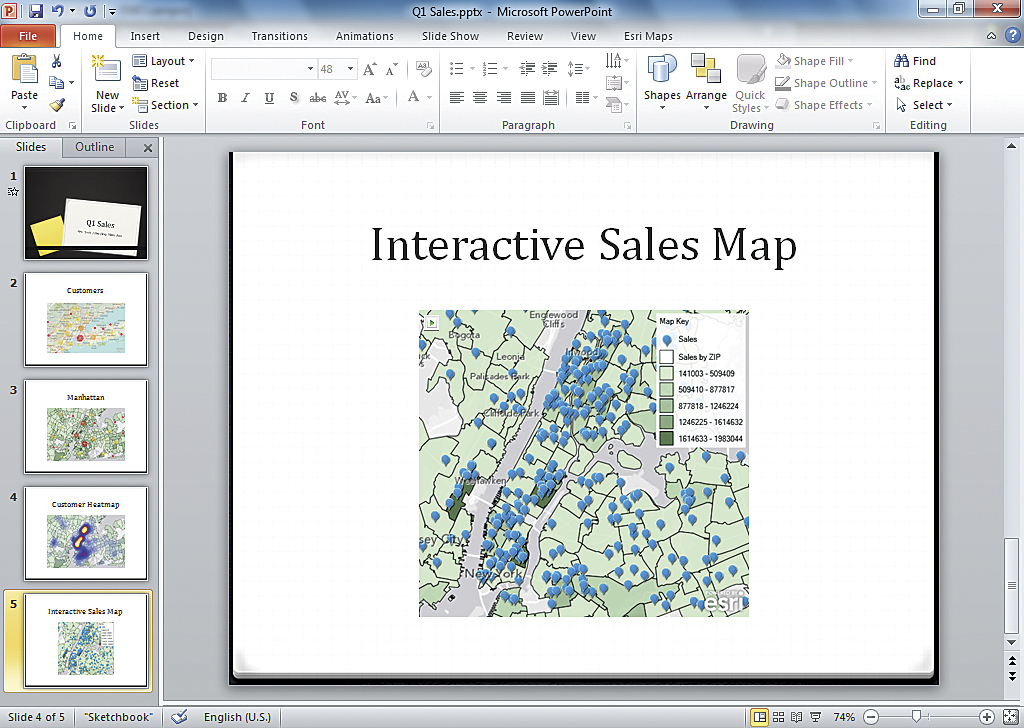

With Esri Maps for Office, users can make data driven maps in Microsoft Excel that can be shared in Microsoft PowerPoint or published to ArcGIS Online.
Richardson: What macro trend do you think is most influencing the adoption of location analytics?
Killick: The consumerization of web mapping has been a huge influence. This started in the late 1990s with the introduction of MapQuest and was taken to the next level with Google Maps and the Google Maps API. More recently though, it has been most influenced by the mass adoption of smartphones and tablets and the location applications that have come along with that. It moved from being about maps to doing business with maps. People are starting to expect maps. People are generally very, very excited just to see their own data on a map. However, as I've tried to communicate previously, location analytics is about much more than just mapping. Yes, it's about dynamic mapping and visualization of your data. But it's also about spatial analytics so you can interrogate your data in a whole new way, and it's about data enrichment, so you can get the context of the people, places, and businesses in the areas where you operate.
Ovens: Unlike 20 years ago, the world now understands the notion and power of a digital map. This is not only driving acceptance of location analytics solutions but actually driving demand. Line of business executives and even CEOs want to see their information on a map. It is no longer simply a nice thing to have, it is essential. The acceptance of the cloud as a platform for both capabilities and content will continue to drive adoptability and pervasiveness of location analytics.
Richardson: Esri is pulling many different products together. How would you see an enterprise making the best use of these technologies?
Ovens: The strength of the Esri location analytics portfolio is that an organization can use the right pieces that make the most sense for its business. If a company relies on business intelligence, we can improve those systems. If Microsoft SharePoint is the mission-critical solution, Esri location analytics makes it better. As we all know, Microsoft Office is pervasive in business. Esri Maps for Office delivers far more than an Excel mapping plug-in. It provides a complete mapping system including collaboration. The point is that there is no one-size-fits-all solution for business. The breadth of the Esri location analytics portfolio allows for flexible deployment of spatial capabilities, enhancing the mission-critical enterprise information systems, whatever these may be.
Killick: Enterprises can use location analytics across their organizations in new ways and get the most from their investments in enterprise IT and GIS. Certainly companies are going to use location analytics to expand on their traditional use of GIS like in a real estate planning department of a retailer that needs to make better decisions about where to open—or close—a store.
But we expect to see the finance department tie in to the GIS system and spatial data using location analytics from spreadsheets. GIS analysts are going to create useful data and map layers that let non-GIS professionals, knowledge workers, and anyone in the organization start using location and geography to make better business decisions. With location analytics, anyone can start to understand the overall performance of their organization, and those people who need to find areas that should be doing better or where there's opportunity for growth, they can start to answer those questions for themselves using the tools they are most familiar with like Microsoft Office or a BI dashboard. Marketing departments can use it for customer intelligence by analyzing who the best customers are by finding out information about them. There are many questions that can be answered: Where are the highest concentrations of people who look and behave like my best customers? How do we reach our best customers? What message would resonate best? Using a nonsiloed approach across an organization means businesses can start to make consistent decisions based on consistent data.
Richardson: The users of location analytics are different from traditional GIS users. How is this influencing your thinking?
Killick: You are right: Typical location analytics users are not GIS users or analysts. They don't work in GIS departments. They are businesspeople. They are knowledge workers. Many of them have never even heard the term GIS or know what it stands for. Typical users will spend much of their day using standard business productivity tools—Excel, Word, or PowerPoint. Some of them may spend most of their day using business intelligence tools and running reports. This is the group that is going to drive the uptake of location analytics.
There will also be a subset of customers who use very sophisticated tools and want to expand them. These are the professional analysts. They spend most of their day creating financial models in SAS or IBM's SPSS or perhaps authoring BI reports for the rest of their organizations. Our products are also designed to appeal to this group—that's why we don't have a one-size-fits-all approach. Our audience needs to create impactful, insightful reports and presentations for senior management. Adding mapping and geographic analysis dramatically expands what they are doing now. Many users will be accustomed to using simple mapping tools and consumer technology, so Esri's location analytics is ideal for this segment.
People don't have the time or desire to learn software; they just want it to work. They expect their business applications to be as easy and intuitive as their best consumer applications on their iPad or smartphone. When people use location analytics, they expect to understand it immediately and use it. That's what we are giving them.
While we are focused on the everyday business users and knowledge workers who spend their days working in Excel or with BI, we also have to cater to professional analysts. These users need the power and flexibility to perform ad hoc queries or create sophisticated models. We have to give these users what they need too—but at the same time keep it extremely intuitive, and hopefully fun.
For more information, visit esri.com/software/esri-maps-for-ibm-cognos/index.html.