|
|
|
Rotating Point Symbols in ArcView GIS
By Mike Price, Mining Industry Solutions Manager
Editor's Note: This article describes how to properly rotate symbols in ArcView GIS by applying
real-world compass measurements. Visit the "Terrain Modeling with
ArcView GIS" page on this Web site to read previous articles that describe downloading, converting, and modeling
with various types of data Digital Line Graphics optional
format (DLG-O) vector data, digital elevation model (DEM) raster data,
and Geographic Names Information System (GNIS) label points--available
from the U.S. Geological Survey (USGS). This Web page includes sample
data sets for previous articles, conversion utilities, and links to data
sites on the Web.
The sample data for
this article, called placitas.zip, can be downloaded now. After extracting the 13 files for this exercise from
the zipped file, retain the zipped file in case you want or need to redo
some or all of the steps described here. Once the symbols in a project
are rotated, they cannot be unrotated.
More Uses for Symbology
Many industries
are using more complex symbols for representing point data sets. To
accurately depict this data, some or all of the symbols may need to be
rotated. This tutorial uses a data set that includes sedimentary Strike
and Dip, metamorphic foliation, jointing, and other types of point data
that would be used by geologists and others for structural modeling.
This data set is based on the USGS Placitas New Mexico 7.5-minute
quadrangle and contains a point file and associated geology polygons.
The sample data can be combined with other data available from the USGS
site for the Placitas area such as DLG-O, DXF, and GNIS data. The
project data is Universal Transverse Mercator (UTM) projection North
American Datum for 1927 (NAD27) Zone 12. Any additional data needs to be
in or reprojected into UTM NAD27 Zone 12. The data set includes a point
data file called PLACPNT1 and a polygonal geology file called PLACGEO1.
Create a directory for this project call PLACITAS. Unzip and place all
the files for this project in the PLACITAS directory.
The Geologic Symbol Palette
Both ArcView GIS 3.1 and 3.2 include a palette of
selected geological point and line symbols. This marker and pen palette,
named geology.avp, as well as many other special-use symbolsets for
forestry, transportation, and other disciplines, come with ArcView GIS.
The symbols in the geology set represent many types of geologic point
and line features as defined by the USGS in the Open File Report 95-525
and its successors that are the current standards for geologic
symbology.
The palette includes 108 marker symbols for minor geologic
point types and 168 line types for representing major geologic line
features. The point symbols were created as TrueType fonts so they can
be scaled and rotated. Line Symbols that have directionally sensitive
crossing symbology are duplicated in the palette so changes in line
direction can be correctly digitized.
Field observation of geologic point sources often includes the following measurements:
- Strike or trend Azimuth or Bearing
- Crossing orientation (e.g., Dip direction
- Crossing magnitude (e.g., Dip
angle)
Points are
plotted on maps to represent linear
and crossing geometry, and they are often attributed with a
value showing the size or magnitude of Dip. Point symbology may be rotated
in an ArcView GIS view to display the true orientation of field data.
Field geologists and surveyors use one of two methods. Azimuth
and Bearing. to measure and record angular field
relationships.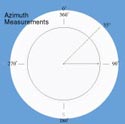
Azimuth
Measurements begin at north with 0�, rotate
clockwise 90� to the east, then on to 180� due south, next to 270� to
the west, and return to 360� at north. The 360� system of Azimuth is
shown here.
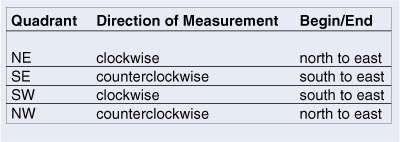
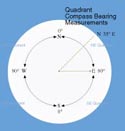 Bearing
Bearing divides the 360� compass Azimuth into four quadrants of 90� each, named northeast (NE), southeast
(SE), southwest (SW), and northwest (NW). Angular rotation in each
quadrant is measured from the vertical axis (the north-south compass
axis). The table and illustration shown here summarize the
concept of Bearing and the direction of measurement for each quadrant.
Field Mapping Issues
Several important issues must be
considered when collecting and recording geologic data. Both Strike
orientation and Dip Direction must be represented. Strike is a
bidirectional linear measurement describing the intersection of a plane
and a horizontal surface. Dip Direction represents the steepest line of
fall on the horizontal measured plane; it is the path a marble,
influenced by gravity, would follow as it rolled down the plane surface.
Dip Direction is a unidirectional measurement and is always
perpendicular to Strike. The illustration shown here explains the
relationship between Strike and Dip. The illustration shown here explains the
relationship between Strike and Dip.
To simplify field measurements, Dip Direction is often combined with Strike by applying the
Right-hand Rule. To use the Right-hand Rule when measuring Strike with
a compass, always keep the Dip Direction to the observer's right, as
though he was looking at his right hand, palm side up, and his right thumb
was pointing to the "down-Dip" side. Using this method of recording
data will consistently record the Dip Direction in a clockwise rotation
relative to Strike. The figure above demonstrates the application of
the Right-hand Rule.
If angles are intentionally or accidentally measured using the opposing Left-hand Rule, they can be
shifted by adding or subtracting 180� to the Left-hand Azimuth or by
swapping north for south or east for west with a Left-hand Bearing.
Surveyor's Trick
To obtain a back-sight Azimuth or to reverse your path
of travel and head home, add 180� to a forward compass Azimuth that is
less than or equal to 180�, or add 180� to an Azimuth that is greater
than 180�. If you use Bearings, swap the N for S and E for W in the
Bearing description (or vice versa), and you will be headed back home.
For example, to obtain a back Azimuth for an Azimuth of 227� (generally
southwest), subtract 180� to calculate 47� (generally northeast). To
reverse a Bearing of S82E (slightly south of east), swap the S with an N
and the E with a W to obtain N82W and return toward the west.
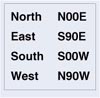 When recording an orientation using Bearing measurements,
a cardinal direction may be recorded in two ways (e.g., north can be shown
as N00W or N00E). Although the method described in this article
will rotate symbols using data with either Bearing measurement notation
style, the abbreviations for cardinal orientations shown here are
recommended. When recording an orientation using Bearing measurements,
a cardinal direction may be recorded in two ways (e.g., north can be shown
as N00W or N00E). Although the method described in this article
will rotate symbols using data with either Bearing measurement notation
style, the abbreviations for cardinal orientations shown here are
recommended.
ArcView GIS and Angles
ArcView
GIS uses the Radial Coordinate System to manage angular measurements and to orient
data. In this system, 0� is oriented to the right
along the positive x-axis. Positive angular rotation proceeds clockwise 90� to the positive
y-axis, then to 180� on the negative x-axis, then to 270�
to the negative y-axis, returning to 360� on the positive x-axis.
The Azimuth and Bearing systems may be related to the Radial
Coordinate System through complex radial mathematics to convert field data to values used by
ArcView GIS to rotate geologic point symbols.
A conversion table for ArcView GIS in dBASE format named AZCONV.DBF
has been included with the sample data to simplify the rotation process.
Joining field data, recorded as Azimuth or Bearing, to the
AZCONV table will assign proper ArcView GIS rotation angles to the field
data points.
The table contains 365 records, one for each whole
number of degree measurement from 0� to 360�, plus four additional
records to include alternate Bearings for north, south, east, and west.
Using the Conversion Table
Following is a step-by-step example of how to
use the conversion table to rotate point data.
- With the unzipped sample data and AZCONV table in the PLACITAS directory, begin a new
ArcView GIS project and add a new view but don't add any themes.
Load the geologic symbol palette by choosing Windows >Show Symbol Window from the menu bar. Click on the Palette icon located in the upper right
corner of the dialog box. In the next dialog box, click the Load button
and path to the geology.avp palette, which typically will be located in
the ARCVIEW\SYMBOLS subdirectory in the location where ArcView GIS was
installed. After loading the palette, click on the marker button icon
and scroll down to verify that the geologic point symbols have loaded.
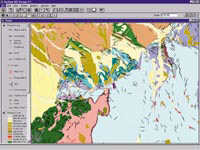
- Add the PLCAPNT1 and PLACGEO1 shapefiles, stored in the PLACITAS
directory, as themes to the view.
 When displayed, these themes should
have custom legends that have already been classified. The PLACPNT1
theme has the correct geologic symbol assigned to each type of data.
Notice that all these point symbols are oriented in an east-west
direction, and the Dip is pointing to the north. This does not
accurately represent the data and needs to be corrected. When displayed, these themes should
have custom legends that have already been classified. The PLACPNT1
theme has the correct geologic symbol assigned to each type of data.
Notice that all these point symbols are oriented in an east-west
direction, and the Dip is pointing to the north. This does not
accurately represent the data and needs to be corrected.
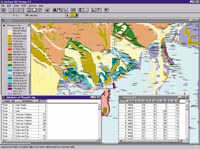
- Make the PLACPNT1 theme active and display its table. Verify that the fields for
Strike and Dip data are present and determine if the measurements are in
Azimuth or Bearing. In the PLACPNT1 table all measurements in the Strike
field are in Azimuth.
- In order to use the AZCONV table to correct the
orientation of the symbols for the PLACPNT1 theme, the AZCONV table must
be joined to the table for the PLACPNT1 theme. Go to the project window,
highlight Table, click the Add button, and path to the PLACITAS
directory containing AZCONV.DBF to add it to the project.
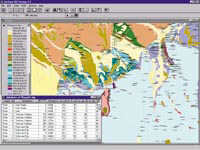
- With both
the AZCONV and PLACPNT1 tables open, make AZCONV active and select the
Azimuth field. Next make the PLACPNT1 table active and select the Strike
field. Choose Tables > Join from the menu bar to join AZCONV to
PLACPNT1. AZCONV should close, and PLACPNT1 will contain the fields from
both tables. Inspect the Join to verify that all point records have a
corresponding conversion. When joining data sets that use Bearing
measurements, carefully check north, east, south, and west points to
verify that they are complete and remember to enter north as N00E, east
as S90E, south as S00W, and west as N90W.
- Now the Strike and Dip
symbols can be properly oriented to the mapped points.
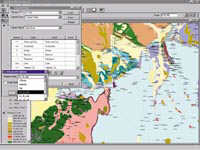 Return to the
view and open the Legend Editor for the PLACPNT1 theme by double
clicking on that theme in the view legend. The geologic points data has
been classified using Unique Value applied to the Symboltype field.
Click on the Advanced Options button on the Legend Editor dialog box and
assign Av_rh_rule (Right-hand Rule rotation) as the rotation field. The
symbols will now be correctly rotated in the view. Return to the
view and open the Legend Editor for the PLACPNT1 theme by double
clicking on that theme in the view legend. The geologic points data has
been classified using Unique Value applied to the Symboltype field.
Click on the Advanced Options button on the Legend Editor dialog box and
assign Av_rh_rule (Right-hand Rule rotation) as the rotation field. The
symbols will now be correctly rotated in the view.
- Save the model.
Explore the characteristics of the data used for this example. Study the
relationship of Strike and Dip in sedimentary areas. Review the
orientation of jointing and foliation in old metamorphic terrain. Note
the relationships between point and polygon data.
 Strike and Dip
symbols are most numerous in areas where sedimentary rocks, joints,
and foliation are mapped in metamorphic and igneous terrain, and
fluvial features are mapped in young river sediments. Look for breccia
pipes and mine adits. Check out the fluvial directions observed in
young Rio Grande Trough sediments in the northwest portion of the map. Strike and Dip
symbols are most numerous in areas where sedimentary rocks, joints,
and foliation are mapped in metamorphic and igneous terrain, and
fluvial features are mapped in young river sediments. Look for breccia
pipes and mine adits. Check out the fluvial directions observed in
young Rio Grande Trough sediments in the northwest portion of the map.
Using Other Data Sets
The sample data set's prebuilt legend has been classified, and
the appropriate symbols are associated with each data type. To use other
geologic point data, thematically symbolize each individual data type by
using the Legend Editor to classify the data set using Unique Value and
the field in the data set that identifies the type of data. Assign the
appropriate symbol from the geology.avp palette.
ArcView GIS Trick
To make a custom legend load with an ArcView GIS theme, use the Legend
Editor to save the legend with exactly the same name as the name for the
theme's shapefile and store the legend file in the same directory as the
shapefile. For example, the shapefile for the exercises in this article
is called PLACPNT1.SHP, and its custom legend is PLACPNT1.AVL. When
ArcView GIS loads the theme, it will automatically apply a legend with
the same name to the theme and load any necessary standard palettes.
Many digitized geologic maps contain several Left-hand points mixed with
Right-hand points because the data was recorded with the wrong
orientation in the field or was improperly digitized. Data that has a
mix of Right-hand and Left-hand points can be handled in one of two
ways. If there are just a few entries with Left-hand data, the simplest
solution is to correct individual fields in the table by editing them.
If a substantial number of records contains Left-hand data, a query can
be used to correct the data. Create a new field in the point data table
to flag which type of data is in each record. Choose Theme Properties
from the menu and create a query to separate the two orientation types.
Duplicate the point theme, symbolize each set, and apply Av_rh_rule to
the Right-hand points and Av_lh_rule to the Left-hand points.
To learn
more about classifying legends and building queries, see Getting to Know
ArcView GIS from Esri Press, which is available from the GIS Store at
the Esri Web site.
Summary
This procedure will correctly orient geologic symbols in ArcView GIS 3.1 and 3.2 by joining
adjusted Azimuth and Bearing values to point data that may have been
incorrectly collected or digitized. The next step might be to explore
the USGS EROS Web site and locate other digital geologic mapping data
and apply the AZCONV table to attributed point data to properly orient
the geologic symbols.
The author thanks the staff of the New Mexico
Bureau of Mines and Mineral Resources for graciously providing the
digital point and polygon data for this exercise. Please note that this
data is preliminary and has not been field checked.
|