October - December 2004
October - December 2004 |
||||||||
|
|
||||||||
The Water Utilities Department for the city of Garland, Texas, has run a criterion driven potable waterline replacement program for more than 25 years. From its inception, the deciding factor for determining which portions of a waterline to replace was the number of line breaks a given segment experienced over time. These incidents have been continually documented and are prioritized for annual replacement as funding becomes available. The Water Utilities Department maintains approximately 1,000 miles of potable waterline within the city's 57-square-mile boundary. Located in the northeastern quadrant of Dallas County, Garland has a population of more than 220,000, making it the fifth largest city in the Dallas-Ft. Worth metropolitan area and the 10th largest city in the state. For the purposes of the replacement program, the city is divided into north and south regions and data is maintained so that lists of segments can be created by street for inclusion in the annual replacement program. The list is developed by north/south designation, number of breaks, street name, and type of street. When making determinations regarding annual project funding, this list is reviewed to identify the streets where the most documented line breaks have been observed. Those areas are prioritized and a schedule developed for line segment replacement. Line breaks occur across the city. However, the focus of this article is a 15-square-mile area in the city's southern region. Since 1978, this region has experienced an unusually high rate of line breakage. This area contains 18,874 single and multifamily housing units with a population of 61,305. Although it represents only 25 percent of the city's total area, 36 percent of the line breaks that have resulted in waterline replacement have occurred here. From 1978 to the present, a total of 3,182 breaks have occurred in this area.
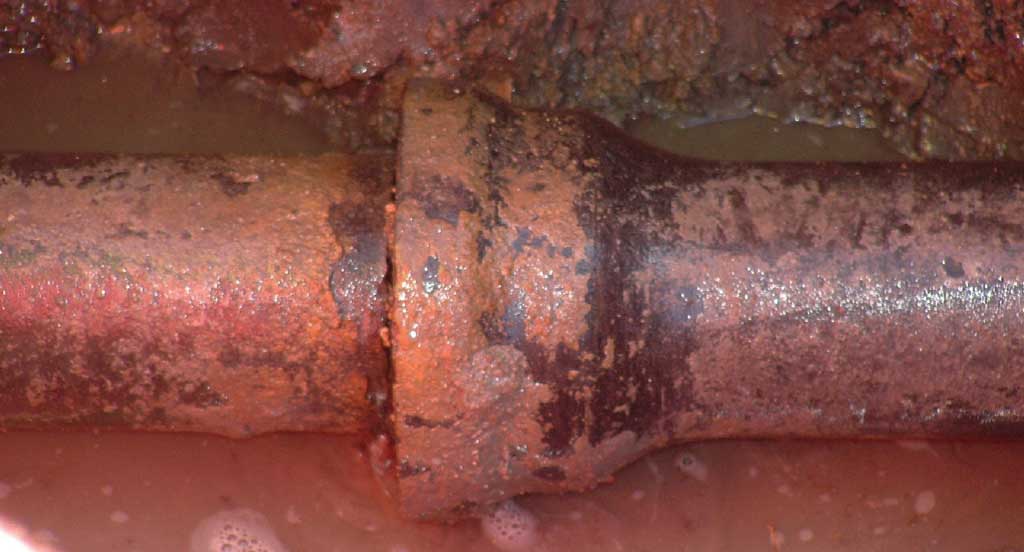
In response to these breaks, slightly more than 24 miles of line have been replaced. Breaks are occurring at an average annual rate of 51 per 100 miles of line. In the rest of the city-42 square miles-the annual average is 30 per 100 miles of line over the same period. Most of the city's waterlines, originally installed in a 10-year period from 1960 to 1970, were fabricated from cast iron. Toward the end of decade, some ductile iron lines were installed. The preferred line material for the replacement program is PVC piping. Limited Life SpanWater utility officials were becoming increasingly concerned with the life span of waterlines in the southern portion of the community. Under uniform installation specifications, the life span of cast iron and ductile iron should have been much longer than the observed life span. Looking for answers, water officials turned to the city's GIS to help determine the cause of these early infrastructure failures. While water officials had long suspected that soil conditions in the southern region of the city might have a role in these early failures, no real evidence existed. The city's GIS Department, in existence since 1997, assists a wide variety of city departments with management and geographic information. Water Utilities Managing Director Jack May, an avid proponent of GIS and its capabilities, was one of the principals on the steering committee that sold the idea of creating a GIS resource in the city. In 2003, May asked the GIS staff to help the Water Utilities Department understand why waterlines were failing more often in the southern portion than in other areas of the city. The Investigative ProcessThe GIS Department began its investigation by referencing the 1975 Soil Survey of Dallas County, a document that was jointly produced by the National Cooperative Soil Survey; the United States Department of Agriculture; and other federal, state, and local agencies. It showed that 49 different types of soil exist in the city of Garland.
Using ArcView, GIS staff created several map layers that could be displayed by the city's Intranet browser. Layers denoting pH, electric resistivity, soil consistency, and expansion characteristics were developed from the Dallas County Soil Survey and made available so that waterlines could be analyzed in relation to soil conditions. The results of the analysis were revealing. Very acidic soil was found to be more prevalent in the southern area than the rest of the city. Along with acidic conditions, electric resistivity factors supporting electrolysis were also more prevalent in this region although soil expansion ratios were uniformly distributed across the city. When line breaks from the department's database were plotted and overlaid with pH, electric resistivity and soil consistency map layers, areas of high soil acidity and electric resistivity were located in regions where many line breaks have historically occurred. Capital Improvements PlanningUsing information developed by the GIS Department, water utilities officials now have an excellent planning tool for enhancing the potable waterline replacement program. A series of detailed maps show problematic or hot soil where breaks are more likely to occur. This assists water officials in planning and management activities. This new information also allows water officials to better inform the city council and the citizenry of upcoming projects. This creates a defensible working model for maximizing funding in areas where spending will do the most good for the community. For more information, contact David Jacobs, Project Manager AcknowledgmentSpecial thanks to Jack May for introducing GIS tools into the city of Garland Water Utilities Department and his avid participation in its advancement within the city. About the AuthorDavid Jacobs received a liberal studies degree from St. Edwards University in Austin, Texas, and has more than 25 years of experience in operations analysis. His current assignment includes the integration of mobile GIS and workforce management software in the water utility to improve the city's responsiveness to citizens and the city council. |