October - December 2004
October - December 2004 |
||||||||
|
|
||||||||
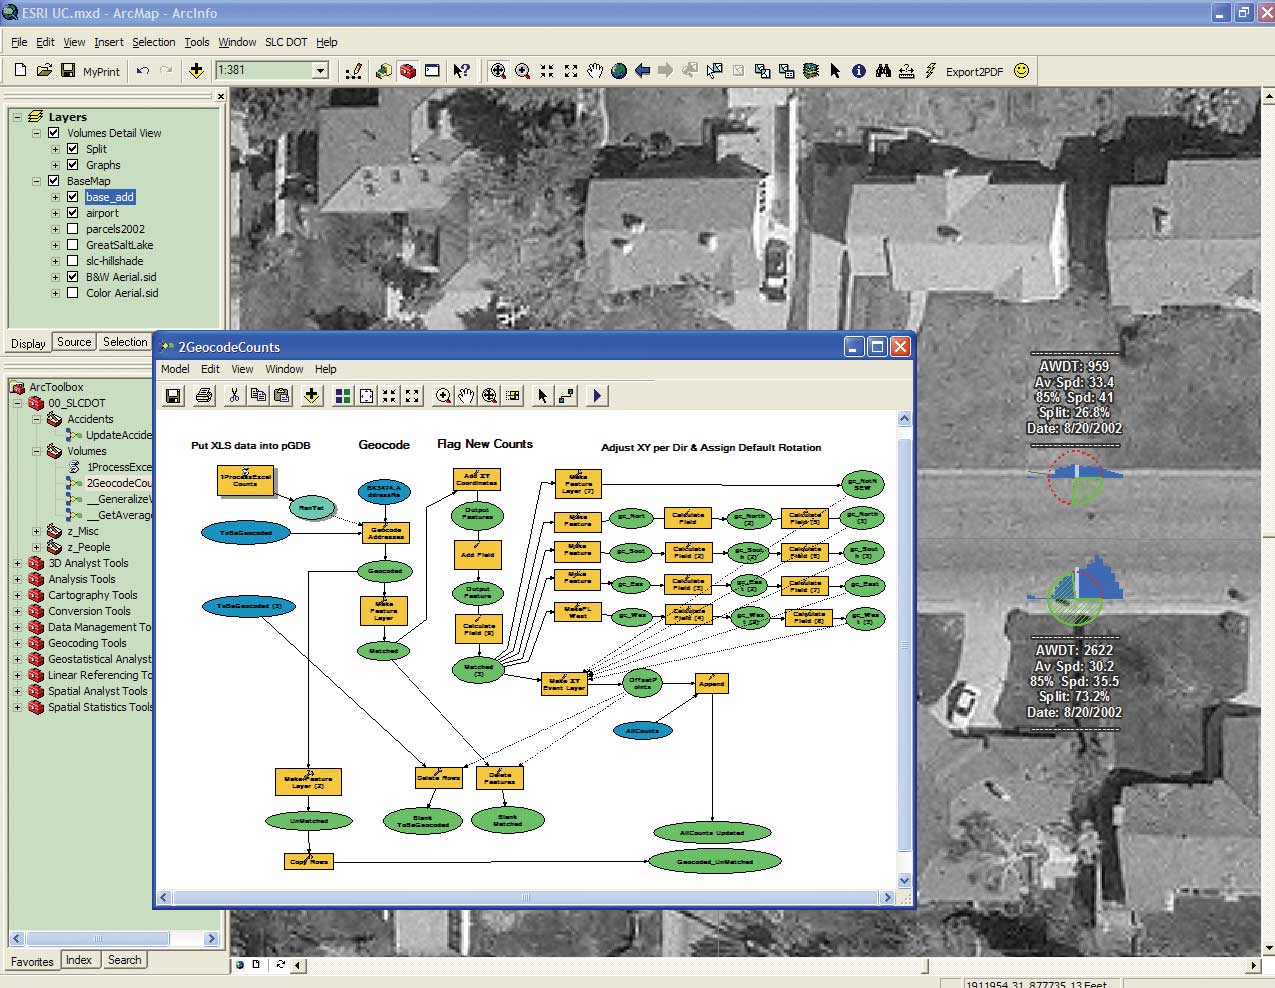
In Salt Lake City's Transportation Division, legacy systems are now integrated and automated using the new ModelBuilder functionality in ArcGIS 9. Transportation engineers have always used hard-copy reports as an aid when making decisions concerning traffic lights, signage, and traffic calming devices as well as everything from supplying information that businesses need for finding suitable locations to looking at traffic accident rates across the city. These reports, which are actually printed copies of Microsoft Excel spreadsheets, are still in use. However, rather than hunting through filing cabinets, the computer files for these reports are accessed through hyperlinks in ArcReader that link to the location of interest. Salt Lake City uses ModelBuilder for both traffic accident analysis and traffic studies. This article looks at how the integration of traffic volume studies with the city's GIS was automated. Gathering Traffic Count DataWhen you're driving down the road, you often run over those little black hoses that are affixed to the street. A puff of air from the hose tells the attached black box that your car has passed. Technicians move these hoses around the city to count traffic volumes for different areas, often as part of special case studies that might, for example, check vehicle speeds near school zones. Traffic data is processed back at the office using software designed specifically for the job. A spreadsheet showing hourly data for traffic flow and speeds, as well as daily averages, is generated. This report is delivered to a city engineer who reviews it and files it away. This work flow served Salt Lake City well for years, so improving it was a challenge. For a GIS technician, placing data in a map requires reformatting the data for database storage, geocoding locations, and symbolizing it in an intuitive manner. The number of reports received each week begged for an automated system that would free up time for other tasks, rather than spending each day torturously repeating these data processing tasks. ModelBuilder, combined with Object Linking and Embedding (OLE) automation in Visual Basic (VB) and Visual Basic for Applications (VBA), now performs tasks in minutes that previously took days to complete manually. Running the ModelThe model developed in ModelBuilder starts with a custom executable written in VB that looks in a directory for spreadsheets that need to be processed. It opens each spreadsheet and reformats the data using Microsoft Excel macros. Control is then handed to Microsoft Access. An ActiveX Data Objects (ADO) procedure builds a personal geodatabase table. During this procedure, the original spreadsheets are moved to an accessible location on the network where all the spreadsheets reside and hyperlink paths are built to them.
ModelBuilder is smart enough to know when the VB executable has finished. It then runs the rest of the model. The new personal geodatabase table is geocoded, and any feature with a confidence score of less than 75 percent is placed in a feature class for manual review and placement. Features with geocoding confidence ratings greater than 75 percent are flagged as new counts that have not gone through visual inspection and are run through the rest of the model. Because one study represents two travel directions but has only one address for each location, feature layers are built per direction. The x,y coordinates are added, and a field calculation is performed to offset the x or y so that the address ends up in the correct travel lane. A temporary table is then built. The new table generates an event theme that is appended to the rest of the studies. The initial table is emptied, all temporary data is deleted, and the new studies are added to the map for visual inspection for accurate placement. The processing of the spreadsheets is complete, and the model is now set up and ready to process another batch of spreadsheets. Displaying the DataBecause the data is already referenced in an ArcReader project, the studies appear on the map properly symbolized and republishing the ArcReader map using the ArcGIS Publisher extension is not necessary. A multilayer symbol was created that shows the average 24-hour flow as a bar graph in the background with a semitransparent pie graph that shows the directional split overlaying it. This symbol makes it easy to discern if more traffic is heading one direction than the other. VBScripting was used to provide complex labels that break down study statistics for a more precise view than can be learned from the symbols. Now the engineers in Salt Lake City's Transportation Division no longer need to search through filing cabinets for basic information. Instead, they can open a map on their desktops and find what they are looking for by zooming to a location of interest. If more detail is needed than is supplied by the graphs, engineers can simply turn on the detailed labels. If the information provided in the labels is still not enough, hyperlinks make each of the trusty original spreadsheets available. By automating work flows using ModelBuilder, ArcReader, and Visual Basic, Salt Lake City Transportation's GIS technician (the author) now has time to work on new challenges rather than spending his workdays in repetitive button clicking. Designing the work flow was the fun part and now ModelBuilder does the day-to-day work. For more information, contact Kevin Bell |