October - December 2007
October - December 2007 |
||||||||
|
|
||||||||
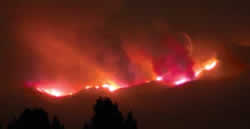
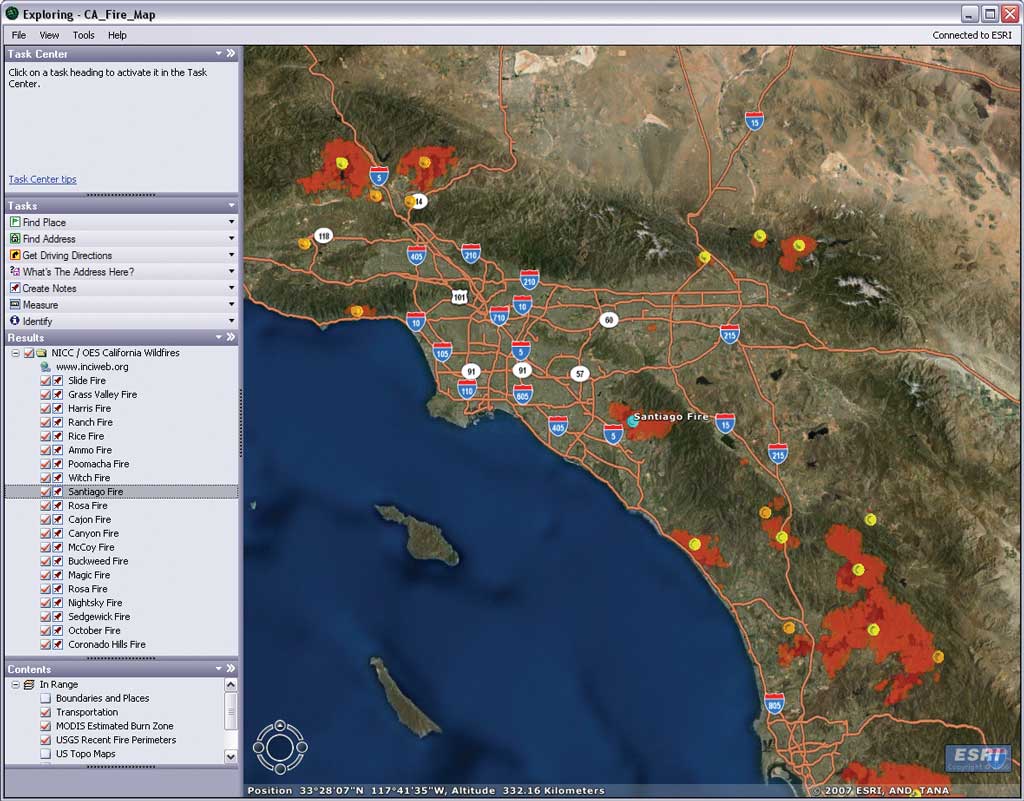
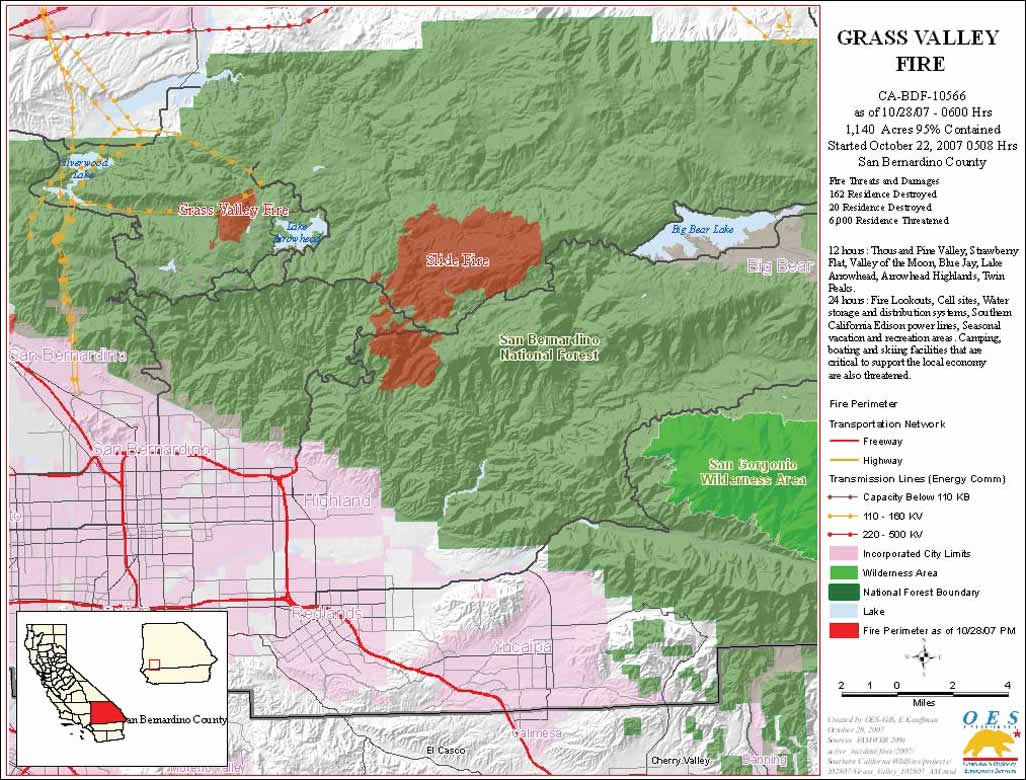
The view looking north from Redlands, California, any evening during the last week in October 2007 was eerily familiar. The San Bernardino mountains were starkly silhouetted by the glow from fires as hundreds of acres of forestland surrounding Lake Arrowhead burned. The scene replicated one most area residents can remember from fall 2003 when wildfires throughout Southern California burned 750,000 acres in an area that stretched from Ventura County to the border with Mexico. The Slide and Grass Valley fires, visible from Redlands, were just two of 20 fires that burned more than half a million acres in Los Angeles, Orange, Riverside, San Diego, San Bernardino, and Ventura counties during October and November 2007. Aided by a combination of drought conditions, high winds, and unseasonably high temperatures, these fires burned thousands of structures and caused the evacuation of hundreds of thousands of people. Agencies responding to wildland fire events use GIS to map fire perimeters and fire progression, identify critical facilities and infrastructure, allocate resources and equipment, site disaster relief centers, carry out evacuations, perform property and community damage assessments, and develop recovery plans. Using GIS, fire specialists modeled vegetation, slope, and other features and incorporated weather and other conditions to predict the effect of these factors on fire behavior. Public information officers used GIS to answer media questions and supply information to the public about fire locations, road closures, evacuations, shelter locations, and damaged or undamaged property locations.
Although GIS was used in fighting wildfires in both 2003 and 2007, the role of GIS has greatly expanded in the four years between the two events. Tom Patterson was the Bureau of Land Management's assistant fire management officer for the California Desert in 2003 and is now Esri's specialist for wildland fires. In commenting on the differences between the two events, he recalled, "GIS was almost an afterthought. Responders didn't think about GIS until they were on scene. It was three days before fire perimeter data was available. This time, that kind of information was available within 24 hours." In contrast to the situation in 2003, developing base datasets before incidents occur is now part of agencies' standard operating procedures. Consequently, base layers were in place and readily available in 2007. One of the reasons for this change was the approval of the GIS specialist position by the National Wildfire Coordinating Group (NWCG). With the creation of this position came the adoption of a set of guidelines, the GIS Standard Operatingw Procedures on Incidents, in 2006. These guidelines describe in detail the knowledge, skills, and abilities required for the GIS specialist position; the file naming conventions employed; the datasets, documentation, and metadata required; the map symbology used; and the standard map products generated. This standardization ensures a level of readiness, provides consistency in information delivery, and facilitates team transitions and cooperation. During the 2007 firestorms, GIS was used at multiple command centers and the Southern California operations centers, including the Federal Emergency Management Agency (FEMA) joint operations center in Pasadena, and at every incident command post. The visualization capabilities of GIS heighten situational awareness. This was particularly useful for briefings to government and agency officials.
The marked increase in the use of three-dimensional GIS is another area that demonstrates the changes that have taken place since 2003. In that year, ArcGIS 3D Analyst was still in beta testing but was used by Esri staff working at the Joint Information Command Center in San Bernardino, California, to present fire situation information to governor-elect Arnold Schwarzenegger. During briefings for the 2007 fires, three-dimensional visualizations were commonplace. In fact, three-dimensional GIS is now readily available online to the public via a new, free application from Esri. ArcGIS Explorer has made current GIS two- and three-dimensional data accessible to anyone with a computer and an Internet connection.
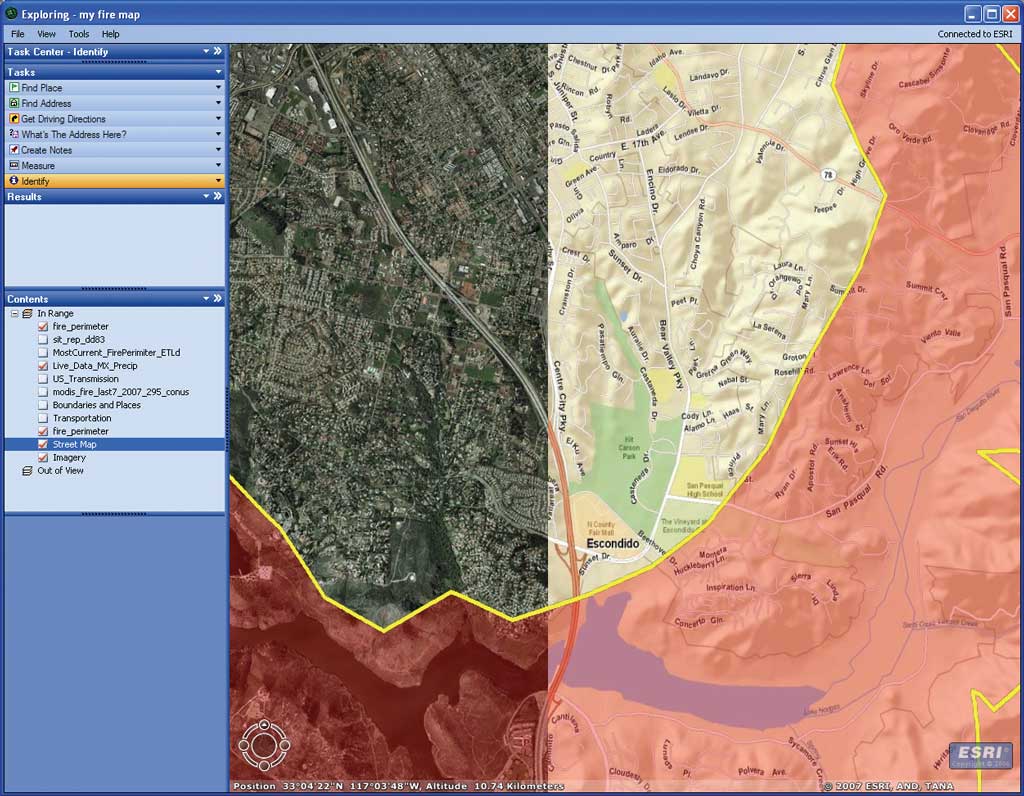
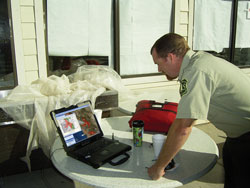
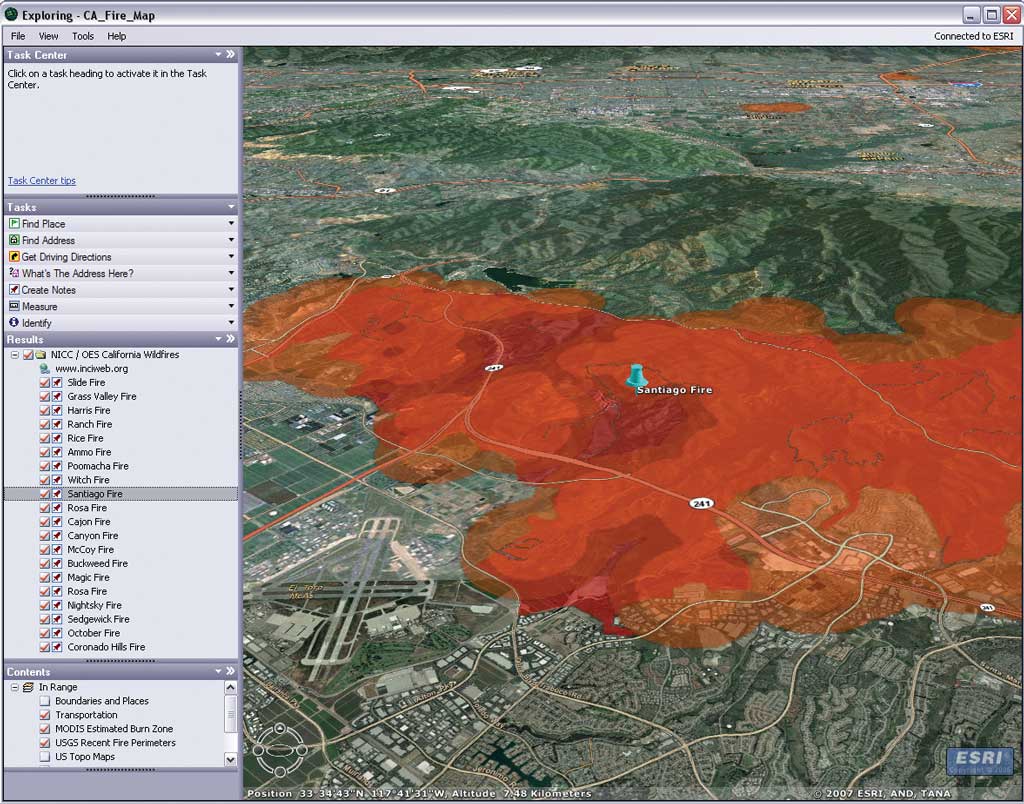
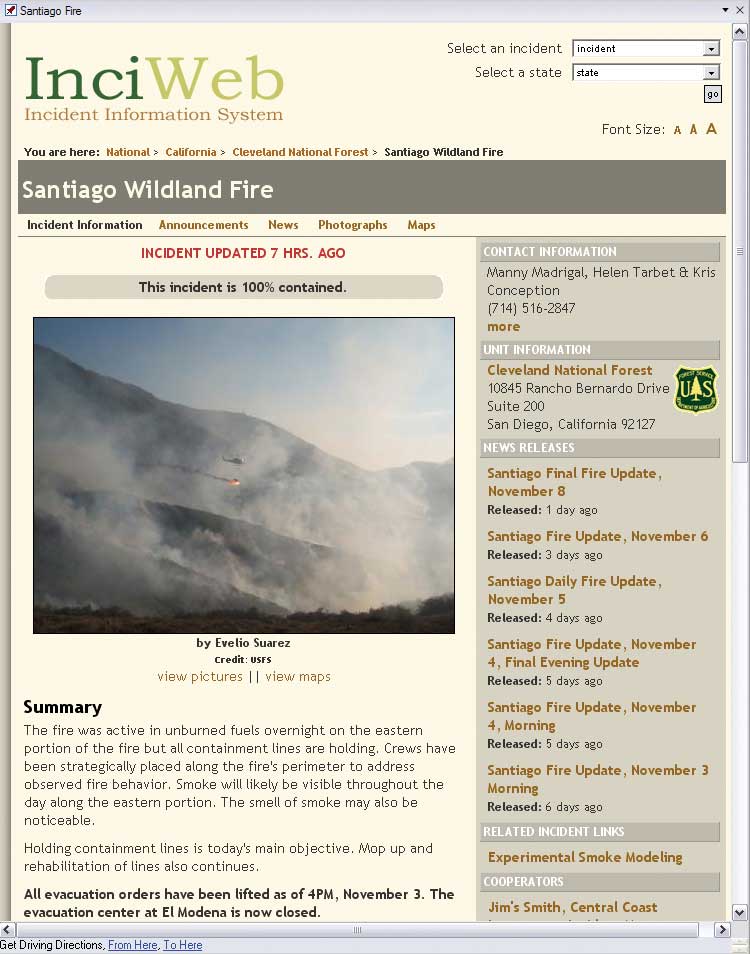
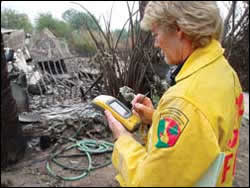
During the 2007 fires, the California Fires map created for ArcGIS Explorer displayed the current perimeters and locations of Southern California fires. The service automatically refreshed every 15 minutes to check for perimeter updates. The map also included a collection of results for each fire area. Clicking the pushpin at a fire location opened a direct connection to the InciWeb site. An interagency wildland fire incident information management system, InciWeb provides standardized reporting tools for public affairs officers and public access to maps, photographs, and information on containment, road closures, and weather for active wildland fires. Damage assessment is another aspect of disaster response that is now more rapidly accomplished using GIS. Patterson recalled that after the 2003 fires, he flew a helicopter over the burned areas and captured a waypoint for each burned house. Subsequently, this location information directed ground crews to burned structures for further evaluation. Now maps created using ArcGIS are exported from ArcMap to mobile units running ArcPad. Field crews take these units into the field, update the information, and take pictures that document damage. This data is imported back to the ArcMap document for further analysis.
Because it provides both analytical and visualization capabilities, GIS is an important tool for responding to many kinds of disasters. It supplies an integrated, common operational picture that enhances situational awareness and communication, and it improves decision making and collaboration among the federal, state, and local agencies dealing with a disaster. The ability to monitor and map events in near real time significantly helps prioritization of tasks and utilization of manpower and resources. Since 2003, Esri has expanded GIS capabilities on a variety of platforms—server, Web, and mobile—as well as the desktop. In addition to its role in creating tools for responding to natural disasters, Esri continues to furnish direct aid to agencies handling these efforts. In 2003 and 2007, GIS software and services from Esri helped government agencies by supplying staff, expertise, GIS technology, and other resources. Support for fighting the wildfires in Southern California is one of many disaster response efforts for which Esri has offered assistance. Previously, Esri assisted with other disasters such as the Indonesian earthquake in July 2006 and Hurricanes Katrina and Rita in 2005. |