Esri's ArcInfo Helps Map the Ayles Ice Shelf Break in the Arctic
Researcher also Used ArcInfo to Study the Ice Shelves along the Coast of Ellesmere Island in Canada
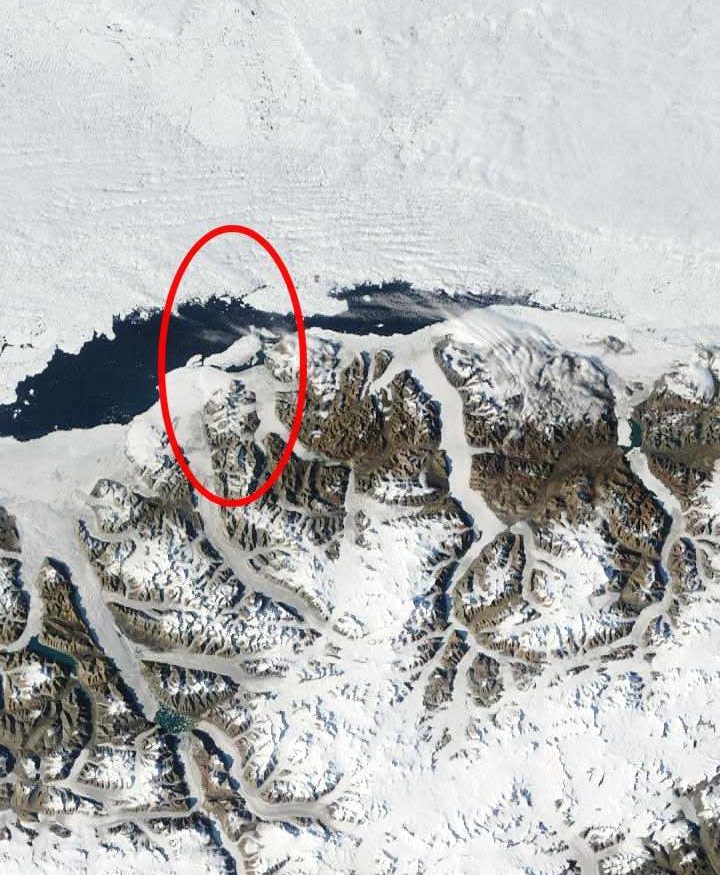 A Moderate-resolution Imaging Spectroradiometer (MODIS) image of the Ayles Ice Shelf breaking away from Ellesmere Island (August 13, 2005 at 20:45 Coordinated Universal Time (UTC). Image courtesy of NASA. |
It was the Arctic ice shelf collapse heard around the world: This past New Year's weekend, the New York Times, CNN, the BBC, the Canadian Broadcasting Corporation, and other media organizations broke the story that the ancient Ayles ice shelf in Canada had cracked from its mooring in an Ellesmere Island fjord and floated into the Arctic Ocean.
With the possible culprit being global warming, all eyes turned north, where the newly formed ice island sits safely in sea ice—so far—about 10 miles off Ellesmere.
"Right now it's frozen in off the coast," said Derek Mueller, a geographer and postdoctoral researcher at the Geophysical Institute at the University of Alaska in Fairbanks, who helped to investigate and write a paper about what happened to the 33-square-mile Ayles ice shelf. In his work, he used Esri's ArcInfo to create a map that helped researchers visualize the chain of events and learn how much ice was lost from the Ellesmere fjord.
Though the ice island has only traveled a short way since the August 13, 2005, incident and there's no clear and present danger to ships or oil drilling platforms, the chance of trouble ahead exists, Mueller said during a recent interview with ArcWatch.
"It could break away at any time and float further down to the south, and it would likely start breaking up as it floats," Mueller said. "These ice islands will be tracked by the Canadian ice service so that ships will be warned," adding that the possibility exists, though slim near term, that the ice island could drift down toward the coast of Alaska with the Beaufort Gyre current and into shipping lanes and toward oil drilling operations. "Worst-case scenario, if it did hit one of the oil drilling platforms, it could cause a lot of damage," he said. Watch an interview conducted by CBC News with Mueller about the ice shelf breakup.
The ice shelf calving was discovered by Laurie Weir of the Canadian ice service in September 2005 while she was comparing satellite images of the ice shelves. She contacted Luke Copland from the Laboratory for Cryospheric Research at the University of Ottawa in Canada, who launched a scientific investigation into what occurred. Though the news spread in some scientific circles and was reported at a conference, journalists did not catch word of the story for 15 months.
Though not enough evidence exists to blame global warming for the collapse of the Ayles ice shelf, Mueller says that what occurred is consistent with other signs of climate change in the Arctic. "Taken together, all of these signs are worrisome," he said.
Sizing up the Ayles Ice Shelf
Having studied the ecosystems on the Ellesmere Island ice shelves as part of his Ph.D. research in biology, Mueller was invited to help investigate the Ayles ice shelf breakup and contribute to a paper the researchers were writing about the calving.
To determine how much ice was lost in August 2005 on the north end of Ellesmere Island, he used Esri's ArcInfo software.
"The break was visible, but what we wanted to know was, 'What was the size of the ice island when it broke away?' " Mueller said, adding that mapping and analysis showed it shrank from about 41 square miles to 33 square miles.
"Aside from the loss of the Ayles ice shelf, 20 percent of the nearby Petersen ice shelf was also lost just after August 13, 2005. And some multiyear landfast sea ice (MLSI) that had been there since the 1940s was lost from Yelverton Bay to the west of Ayles fjord."
After georeferencing and projecting RADARSAT images (provided to the Alaska Satellite Facility by the Canadian Space Agency and its private partners) before and after the ice shelf breakup, Mueller imported the GeoTIFFS (Geographic TIFF format) into ArcInfo. With vector layers, such as coastline contour lines, from the Canadian government laid down, he traced polygons over the top of the RADARSAT images of the ice shelf taken at different times.
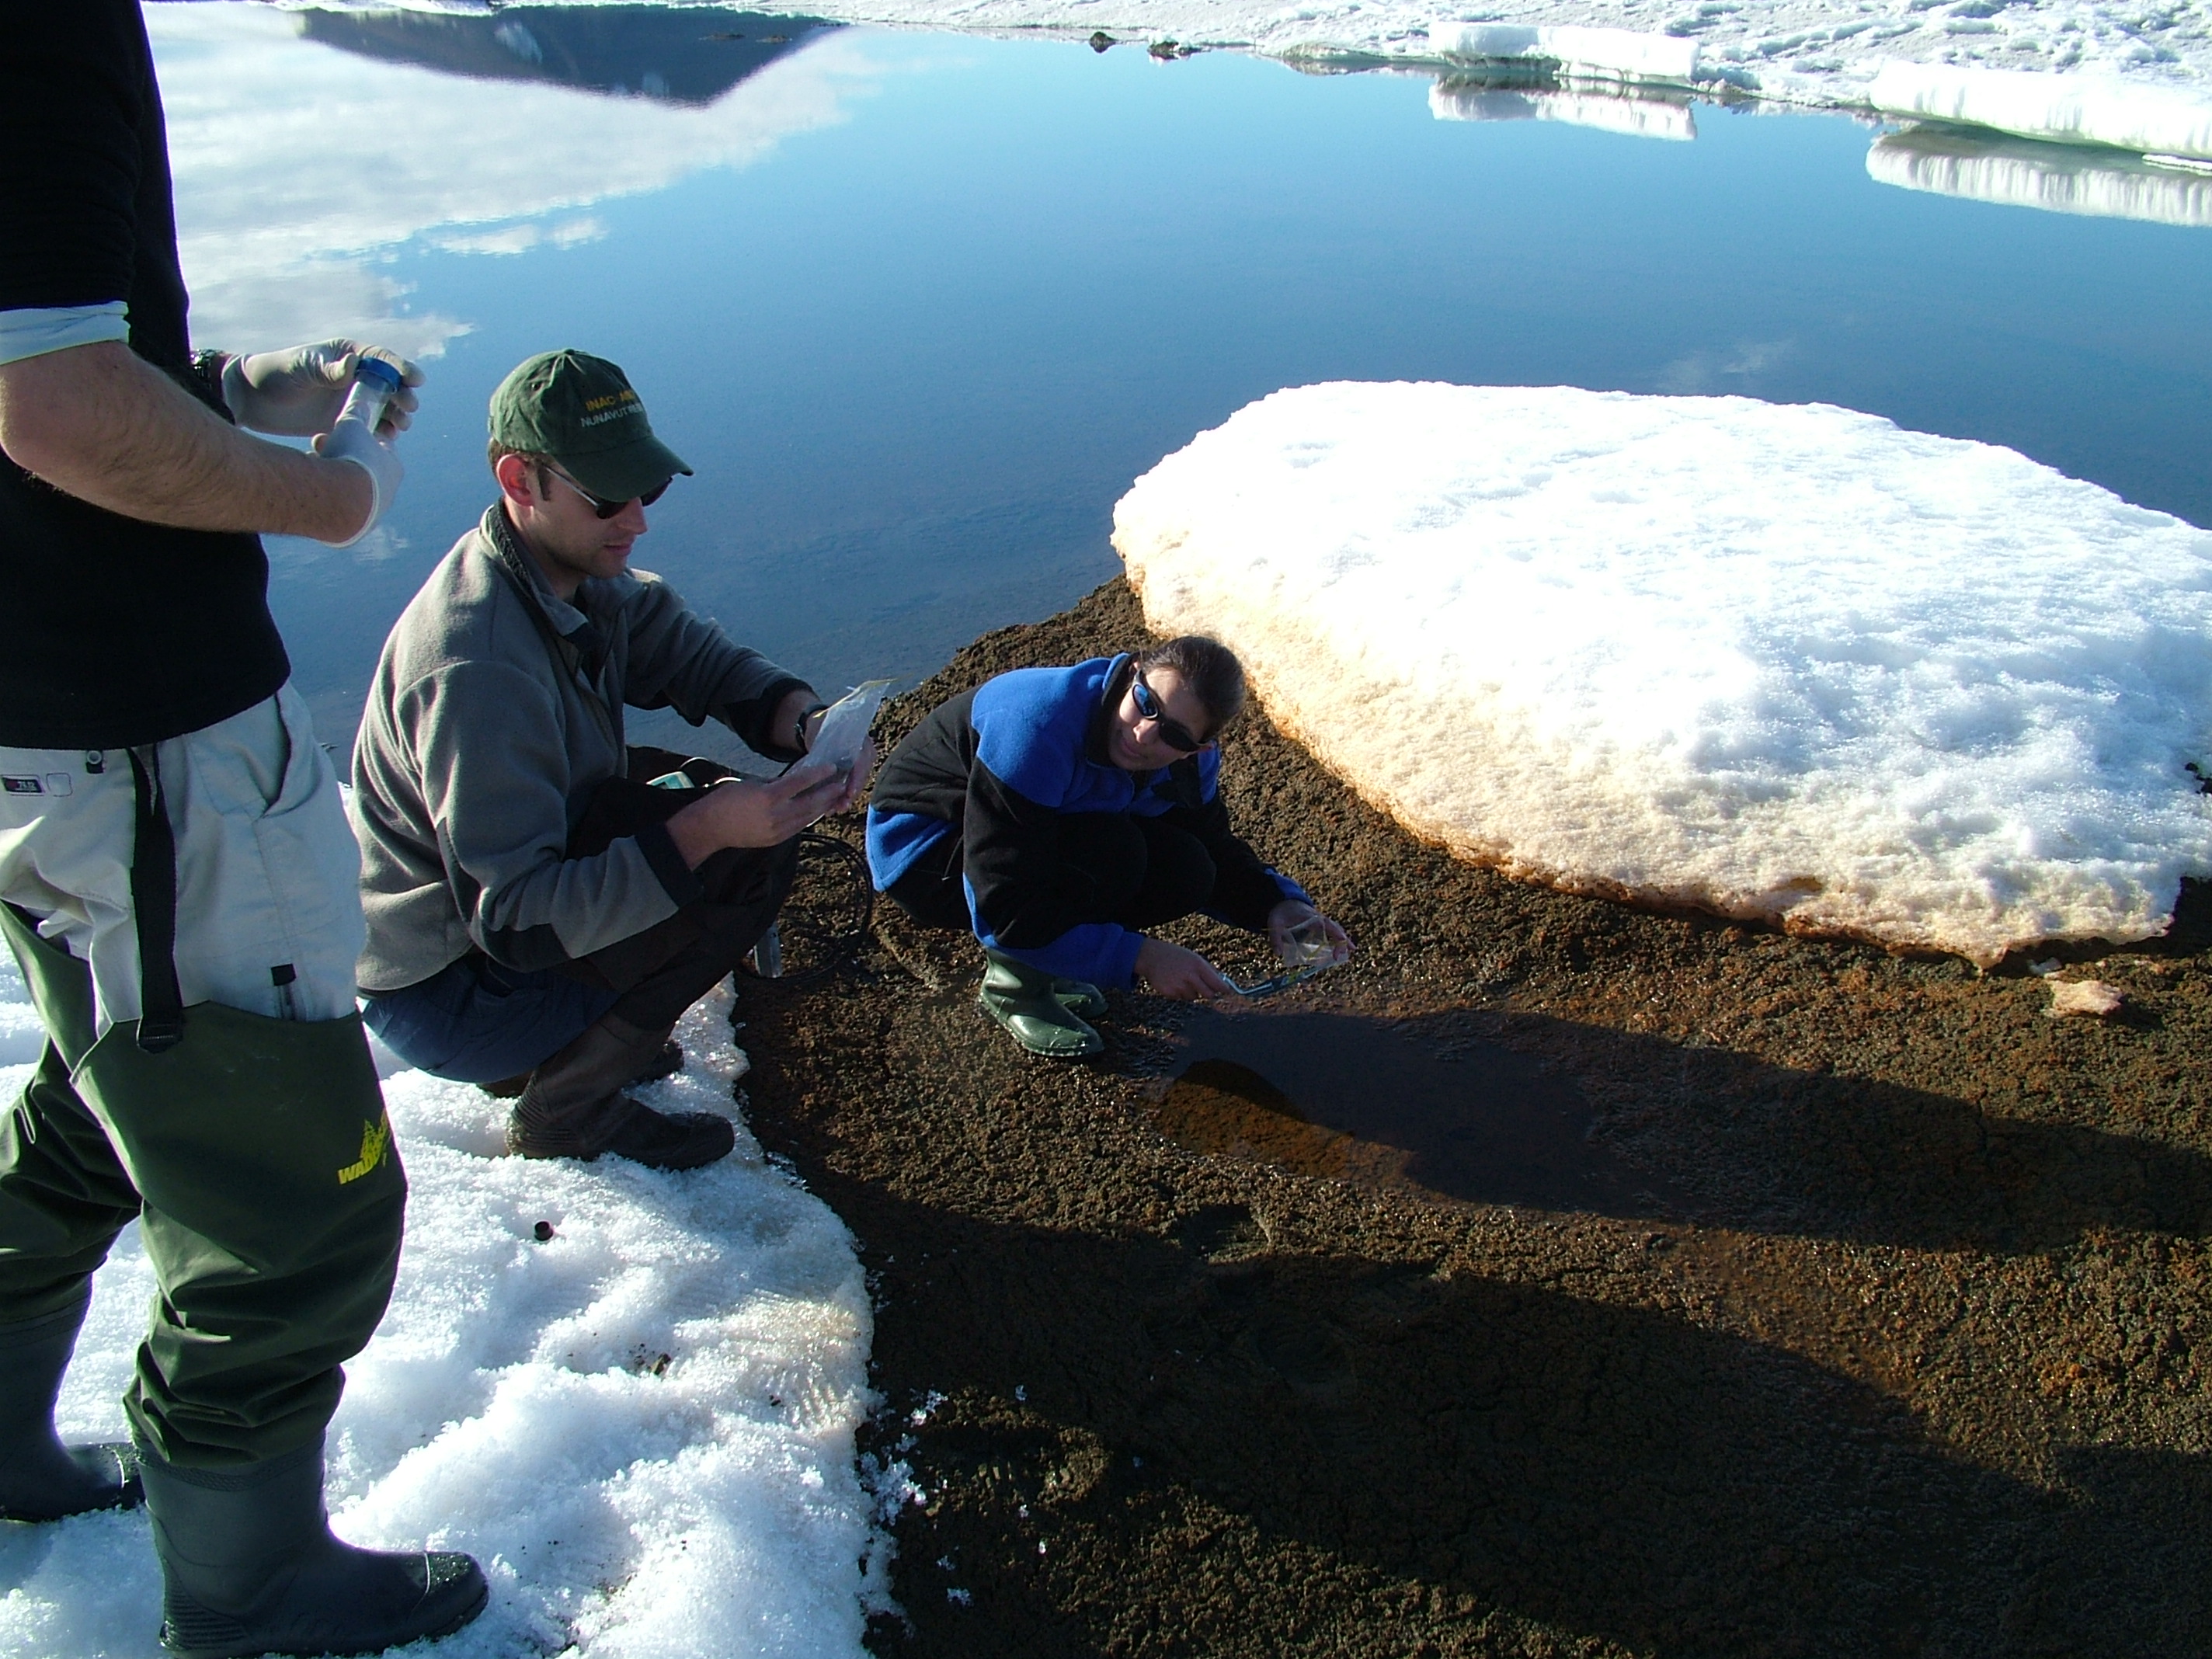 Eric Bottos from McGill University, Derek Mueller from the Geophysical Institute at the University of Alaska, and Alexandra Pontefract from McMaster University sample microbial mats on the Markham Ice Shelf (August 2005). Photo courtesy of Dennis Sarrazin. |
"Using ArcInfo, I put down several images that I could flick back and forth showing where the ice was before any of the activity, calculated the square kilometers—the area of that polygon—then looked again and saw where ice wasn't located," he said. "Then we could essentially calculate the ice loss." The loss was about 54 square miles, according to Mueller.
"ArcInfo helps interpret satellite images," Mueller said. "What is good about that method is you can keep those polygons and flick the image to another time. Sort of like a time machine, you can flick backward in time and forward in time and watch for changes. And if you have a polygon or a vector overlay in ArcInfo, then you can look for your border underneath and, if it alters over time, you know you've got a change."
In studying the Ayles ice shelf breakup, the researchers found that factors in addition to possible long-term climate changes likely contributed to the calving.
In addition to higher-than-usual temperatures that summer, Ellesmere Island was struck by strong winds, according to Mueller. "A lot of the multiyear landfast sea ice broke away from the shore—from the front of the Ayles ice shelf—and a lot of the sea ice was pushed away as well," he said. "That was caused by very strong winds pushing offshore and along shore. Those winds pushed away the sea ice, and that allowed the ice shelf itself the freedom to move away."
Though the new ice island stayed put in the summer of 2006, Mueller said it's not stuck permanently. "It may last another year. It may last another few months. It's not necessarily stable ice."
Even in winter, the humongous chunk of ice could begin moving again. "It's fairly exposed to all the currents that are churning around in that area," Mueller said.
Mapping Ice Types
Mueller also used ArcInfo several years ago when he mapped ice types while studying microbial mats on the ice shelves. Microbial mats, often present in extreme environments, are this planet's oldest known ecosystems.
"I was interested in looking at cold-tolerant organisms in ecosystems that are ice dependent," he said, adding that "microbial mats composed of algae, microinvertebrates, and bacteria are commonly found on the surface of Arctic ice shelves."
In ArcInfo, he mapped the ice types, such as the marine "basement" ice and the meteoric or atmospheric "iced firn," and also noted the sites where he took samples of microbial mats. Mueller will use that map to refer back to as he continues studying the changes in the Arctic ice shelves in the years ahead.
"I'm looking for baseline information on the cryosphere—the cold parts of the earth—to look for changes due to climate warming," he said. "Ice shelves may be a valuable indicator of climate change."
The ice shelves are a unique habitat for microbial mats, which can perhaps provide some clues as to what types of life existed when the planet was younger and how that life evolved, Mueller said.
"When the ice shelves disintegrate, it represents a loss of habitat," he said, adding that he fears the ice shelves may completely break up within his lifetime based on predicted warming of the Arctic.
Working to preserve habitats and biodiversity is important, Mueller said. "These ice shelves may harbor some cold-adapted organisms that could be interesting for biotechnology. Or you might simply value the habitats that we are losing from our landscape."