Early Detection Application Maps Hospital-Reported Symptoms of Illness
By Susan Harp, Esri writer
If a bad flu starts to make the rounds in their city, residents of Kingston, Ontario, in Canada will soon know about the illness from Infection Watch Live, a mapping application on a Web site operated by health officials.
 A new Web application, Infection Watch Live, will use geography to inform an Ontario, Canada, community about respiratory and gastrointestinal illnesses reported from nine area hospitals. |
Infection Watch Live will map illnesses, such as bronchitis and the stomach flu, in near real time based on reports from emergency rooms in and around Kingston. The Web application was developed using Esri's ArcGIS Server technology and is scheduled to become available to the public in February.
The application will generate summary maps of real-time respiratory and gastrointestinal data reported in emergency rooms. Online access to these maps will give health care providers, school officials, and Kingston area residents an at-a-glance picture of where to expect spikes in these illnesses.
Health services groups in Ontario, Canada, are working with GIS consultants to make the information available on a Web site operated by Kingston, Frontenac, Lennox and Addington (KFL&A) Public Health in association with Queen's University Public Health Informatics (QPHI). Visit the site at www.kflapublichealth.ca.
Having access to this data will provide school officials, family doctors, parents, and others with the information they need to prevent and plan for a possible spread of the illnesses. "The key element of this project is enhanced communication and collaboration between the acute care sector, public health, and the community at large to protect the public and prevent illness," says Dr. Kieran Michael Moore, project director at QPHI.
The maps will be of use to public health workers, family physicians, officials at community care access centers and long-term care facilities, school and child care center administrators, and members of the general public. Institutions and schools can better understand and plan for absenteeism, and visitors to the site can also find related disease prevention and treatment information.
Great Way to Disseminate Data
Esri business partner Infonaut, Inc. and the Sault Ste. Marie Innovation Centre developed the application in collaboration with KFL&A Public Health, QPHI, and Esri Canada Limited. GeoConnections, a Canadian government program that promotes geospatial initiatives, awarded sponsorship to develop the application.
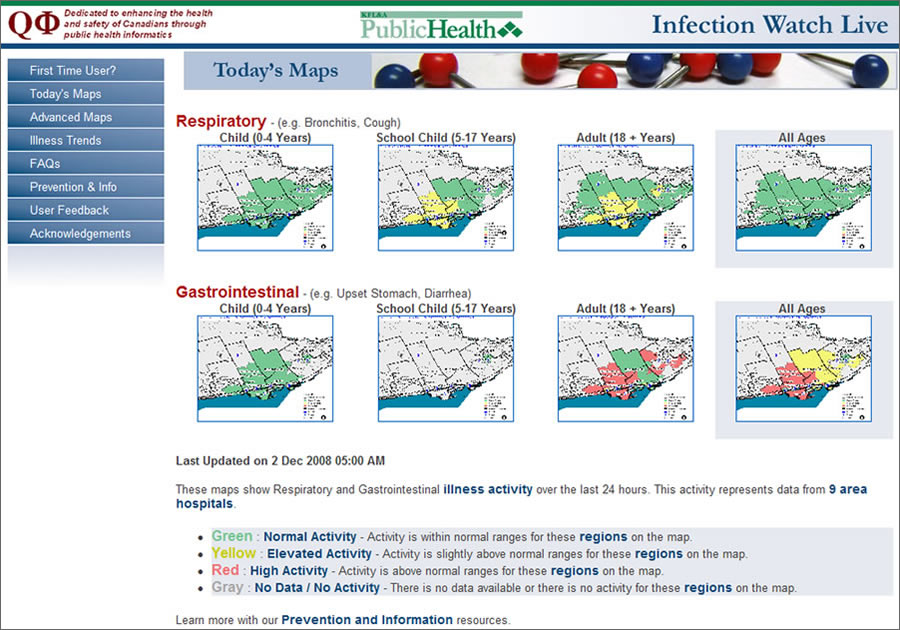 Web site visitors will get an overall picture of what types of illnesses have been reported in the last 24 hours and see affected age groups and neighborhoods at a glance. Health authorities can access more detailed information through a secure connection. |
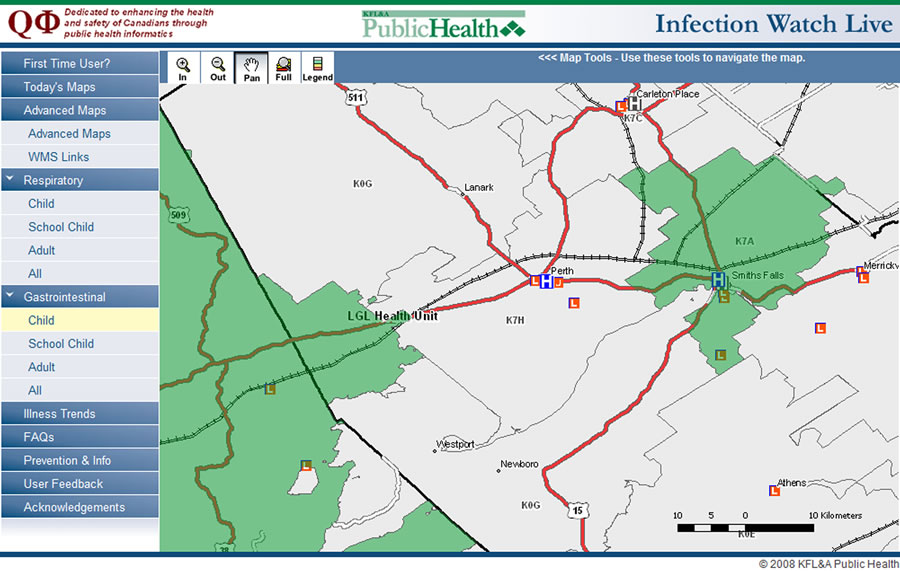
"It's a great way to disseminate data," says Infonaut chief operating officer Matt McPherson. "You can see where a disease is active by partial postal code [first three digits]. You can identify neighborhoods, towns, and municipalities and zoom in to identify different features of the community—schools, hospitals, day care, universities—in relation to reported hospital activity."
The KFL&A area is a public health region that covers some 180,000 residents in the municipal and county areas surrounding the city of Kingston—where Lake Ontario meets the St. Lawrence River—north through Frontenac County and Lennox and Addington County including rural towns and villages such as Napanee, Cloyne, and Sharbot Lake.
From the start, the project's objectives were to help inform the community, understand and limit the spread of disease, reduce mortality and morbidity among at-risk populations, and reduce the impacts on hospital emergency departments. Health officials thought that presenting the most up-to-date information in an easy-to-use interface would provide community members with an easily understood early detection resource.
"The establishment of a surveillance system using data from hospital emergency departments has been an invaluable tool for public health to identify infectious disease risks early," says Dr. Ian Gemmill, medical officer of health for KFL&A Public Health. He adds, "The identification of salmonella in bean sprouts is an excellent example. Extension through the Infection Watch Live Web site to our partners in the community and to the public will provide our whole community with real-time communicable disease activity information, allowing better health decisions."
Seeing Infection Hot Spots at a Glance
The application combines emergency room data with area maps to show which neighborhoods are developing hot spots of infection.
 Web site visitors also may review respiratory and gastrointestinal illness trends for a specific time frame. |
Two variables, respiratory and gastrointestinal complaints, were chosen because of their rapid transmission rates and high burden on community health services. The data source is real-time data collected from nine area hospitals by an electronic collection system adapted from the University of Pittsburgh's Real-Time Outbreak and Disease Surveillance (RODS) system, in use since 2004.
Map data was obtained from the Canadian Geospatial Data Infrastructure, which provides online resources for digital maps and satellite images. A public health epidemiologist working on the project created an algorithm that models the seasonal patterns of respiratory and gastrointestinal infections in the community.
Application maps present a generalized view of illness rates using three color zones—red, yellow, and green—to indicate high, elevated, and normal activity zones, respectively, in a display similar to at-a-glance air quality maps.
This generalized view complies with health data privacy constraints by showing results for each syndrome by age group (child, school child, and adult) and obscuring details about specific hospitals or patients. Results are displayed as a static snapshot of current activity or as interactive maps that display historical activity by syndrome and age group. The application can also make detailed data available to authorized health authorities, providers, and researchers through a secure Web mapping service.
For more information, visit http://www.kflapublichealth.ca/ or contact Hugh Williams at hwilliams@infonaut.ca.