ArcWatch: Your e-Magazine for GIS News, Views, and Insights
January 2011
Where Are Pro Football's Biggest Fans?
Esri Market Potential Data Pinpoints Where Television Viewership for Games Is Great and Small
Football fans are busy preparing for the biggest event of the year—the Super Bowl. They're inviting friends; planning party menus; deciding what team jersey to wear; and, in some cases, buying new big-screen televisions. They want everything to be perfect on game day, February 6, 2011, when two of the best teams in professional football go head-to-head at Cowboys Stadium near Dallas, Texas.
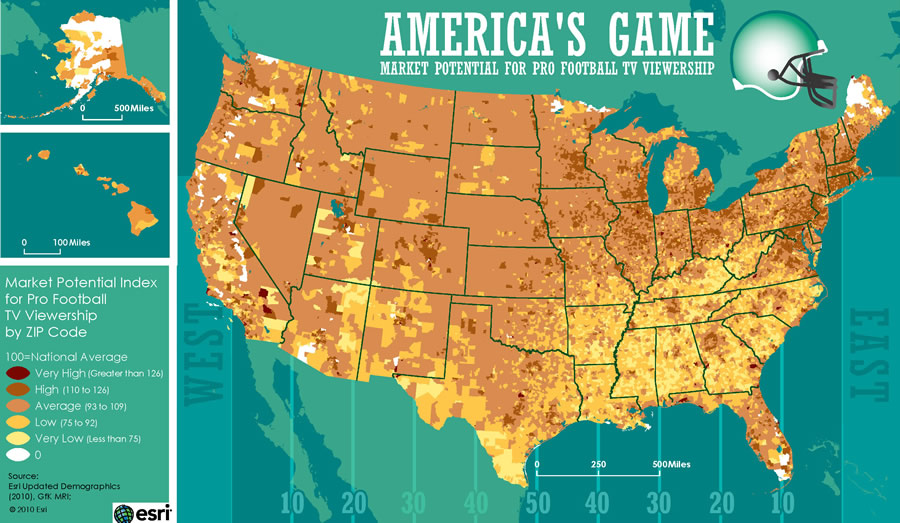
This map shows that television viewership of professional football games is high in populated urban areas on the East and West Coasts and in the Midwest.
Last year, an estimated 106.5 million people watched the Super Bowl—the biggest audience for a program in television history. So just where are these football fans located? The map above, created with Esri's Market Potential data, shows how television viewership of professional football varies around the United States.
As one might expect, some hot spots for watching pro football on television are near densely populated urban areas that host professional football teams, such as New York, New York; Washington, D.C.; and Chicago, Illinois. Esri Market Potential data reveals information, such as where people are inclined to watch pro football, by measuring the probable demand for a product or service in an area. The database includes an expected number of consumers and a Market Potential Index (MPI) for each product or service. The index measures the probability that adults or households in a specific area will exhibit certain consumer behaviors as compared to the United States average. The index is tabulated to represent a value of 100 as the overall demand in the nation. Therefore, a value above 100 represents high demand; below 100 indicates low demand. For example, an index of 120 implies that demand in the trade area will probably be 20 percent higher than the average for the United States. An index of 85 means that demand in the area is 15 percent lower than that of the rest of the country.
Other areas with high indexes for watching football on television are near military bases and college campuses. For example, ZIP Code 23511 in Norfolk, Virginia—home of Norfolk Naval Air Station—has an index of 151. ZIP Code 98433 in Tacoma, Washington, where Fort Lewis is located, has an index of 150. ZIP Code 32304 in Tallahassee, Florida, where students attend Florida State University, has an index of 140. Moderately interested fans are spread across the Great Plains states and upper Northwest. Indexes for these areas range from 93 to 109.
Norfolk, Tacoma, and Tallahassee each have a population of less than 44,000. Conversely, several cities with larger populations spend less leisure time watching pro football on television. Elmhurst, New York's ZIP Code 11373, with a population of 103,762 in 30,883 households, has an index of only 47. People there are not big football fans. The same is true for residents of ZIP Code 90201 in Bell, California, with a population of 109,482 people in 24,257 households. The index for Bell is only 56.
The Market Potential database contains more than 2,200 data variables, with information about goods, services, attitudes, and activities collected from consumer surveys conducted by GfK MRI, the leading producer of media and consumer research in the United States. Data variables are grouped into 35 popular categories such as apparel, electronics, finances, health, Internet, and shopping.
Esri's Market Potential data helps agencies, companies, and organizations better understand, predict, and influence consumer behaviors nationally or in specific market areas in the United States. For example, companies view the data to help identify areas that have the highest potential demand for a particular product or service. Retailers use the information to better understand and provide merchandise for each store based on local consumer demand. Marketers use Market Potential data to develop market plans based on the probability that consumers in an area will buy particular products or services. Sales teams use the data to develop quotas and revenue goals to increase market share by area. City and town governments use the data to define retail opportunities in their locales and market to prospective businesses by industry sector.
Learn more about Esri's Market Potential data.