Investigating the United Kingdom's Geology Using GIS
By Dr. Joseph Kerski, Esri Education Manager
One of my favorite stories is that of the English geologist William Smith. His 20 years of labor led to the world's first geologic map in 1815, which was chronicled in Simon Winchester's wonderful book The Map That Changed the World. After seeing his map of England and Wales while I was teaching GIS and GPS in the United Kingdom, imagine my delight in reading the recent announcement that the British Geological Survey (BGS) launched a Web site called OpenGeoscience. The site uses ArcGIS Online and the ArcGIS API for JavaScript to serve its wealth of spatial data.
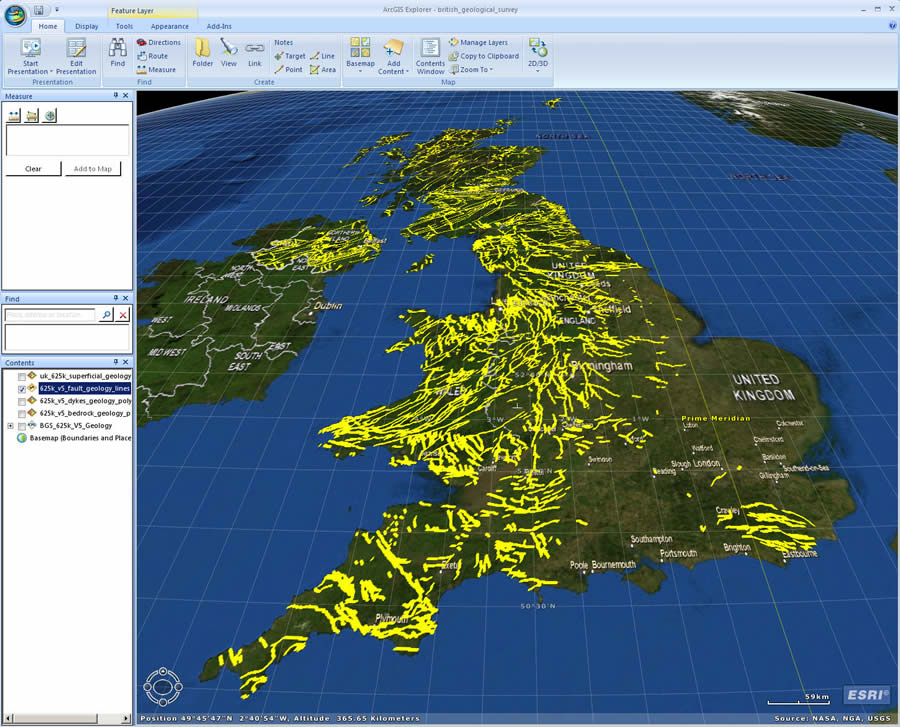 Fault lines downloaded from the British Geological Survey and displayed in ArcGIS Explorer. Why is there a noticeable lack of fault lines in east and southeast England? Image created with Esri GIS software using data, reproduced by permission of the British Geological Survey � NERC. |
All those in GIS know what a frequent challenge it is to obtain data where it has traditionally been offered for a fee and under strict licensure. So this data's availability for educational purposes is a welcome part of a growing worldwide movement to release more data into the public sphere. My Esri colleague Bernie Szukalski describes these BGS resources in this ArcGIS Online blog.
To investigate, I opened the BGS OpenGeoScience online Geology of Britain viewer. The viewer allows the user to zoom and pan on maps and satellite imagery of the United Kingdom at any scale and overlay surficial deposits and bedrock geology, using a standard Web browser.
I found out that the rocks I had been studying that underlie the Liverpool Hope University campus where I taught a few years ago are from the Chester Pebble Beds Formation, a pebbly sandstone. For further investigation, I downloaded the faults, surficial geology, and bedrock geology as shapefiles; saved them on my computer; and added them to ArcGIS Explorer so I could analyze them in 3D. I was immediately struck by the predominance of fault lines everywhere but in southeast England. Is this because the geologic layers are more exposed and observable in the north and west, or is it because the geologic layers in the south and east are younger and have had insufficient time to be faulted?
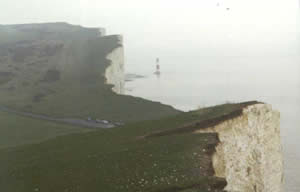
I downloaded the geology and fault data from BGS into ArcMap in ArcGIS Desktop. The BGS layer file contains symbolized faults, dikes, surficial geology, and bedrock geology. I zoomed to one of my favorite places-Beachy Head, in East Sussex which, at 162 meters, is the highest chalk headland in England. I inserted a hyperlink to a photograph I took there during a Geographical Association conference, but I could have also linked to the national archive of geologic photographs in the BGS GeoScenic library. I added base imagery from ArcGIS Online and bookmarked the area so I could easily return to it. What is the geology of these famous cliffs? Selecting the Identify tool indicates that they are the White Chalk subgroup, from the Upper Cretaceous period, with a link for information about the parent unit, thickness, boundaries, book and article references, and much more.
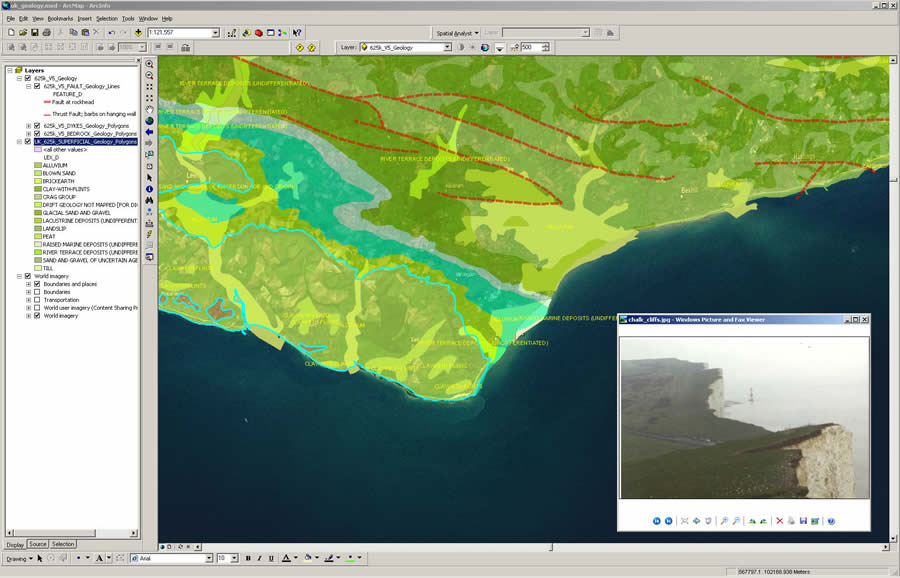 You can use ArcMap to investigate surficial and bedrock geology of Beachy Head, the highest point on England's famous chalk cliffs. Image created with Esri GIS software using data, reproduced by permission of the British Geological Survey � NERC. |
Next, I examined a place I have always wanted to visit-the Giant's Causeway in Northern Ireland, an area covered by more than 40,000 interlocking hexagonal columns of basalt. Sure enough, in ArcMap, according to the bedrock geology, the rocks there are Paleogene mafic lava, or lava rich in magnesium and iron, and tuff, fine particles of volcanic ash that have been welded together into stone. This material is between 23 million and 65 million years old, from the first period of the Cenozoic era. According to the map, the lava and tuff are not overlaid with surficial deposits of unconsolidated sediment that glaciers brought and left there. The absence of this sediment, named quaternary till on the map, is a good thing for visitors of the Causeway because they can walk on and view the hexagonal columns rather than have to dig for them.
A new lesson in the ArcLessons library, Geologic Investigation of the UK with GIS, discusses how to use the online Web mapping tools, how to download the data, and how to use ArcMap and ArcGIS Explorer to analyze the patterns that are inherent in the data in 2D and 3D, respectively. The BGS OpenGeoscience resource provides maps, photographs, data, tools (including a "Make A Map" service), and scientific reports. I encourage you to investigate these new BGS resources and, like William Smith, you will be fascinated by what you find.