Make Maps like the Pros
 Dynamically link data frames with extent rectangles in ArcGIS Desktop. | |
 Apply a layout template to the map. |
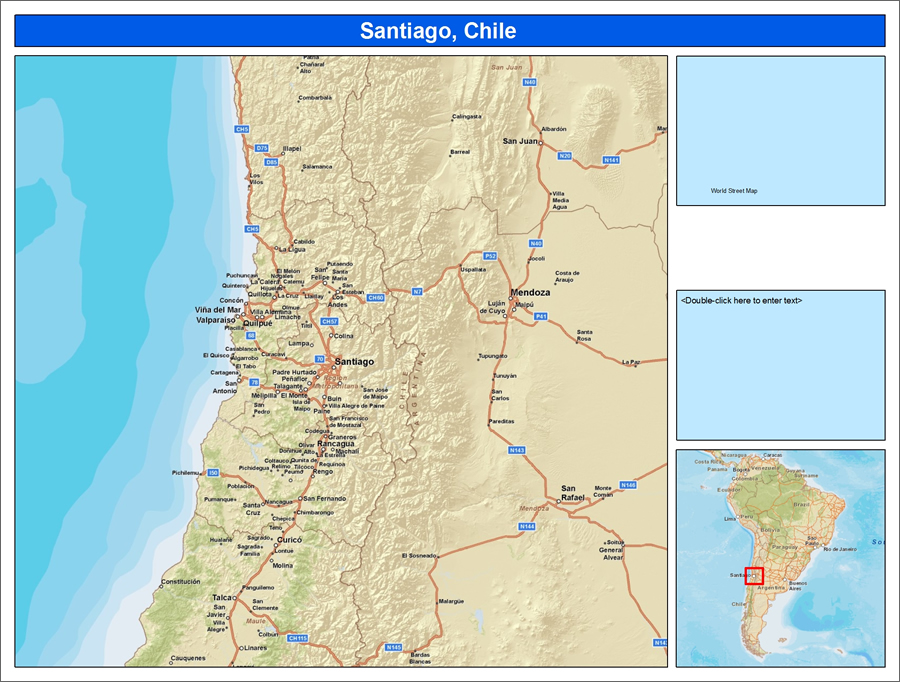
When creating a map that consists of multiple data frames showing the same area but at different scales, using extent rectangles, a data frame property, can help you automate the process. This will allow your readers, for example, to quickly and easily locate which part of the map your main data frame is showing by seeing the other data frame as an outline rectangle.
To work this tutorial, you will need ArcGIS Desktop 9.3 and access to the Internet and ArcGIS Online. Begin by starting ArcMap in ArcGIS Desktop and create a new empty map document. For this example, you will use data from Santiago, Chile. In the table of contents, change the data frame's name from the default Layers to Santiago - AOI. This will be your Area of Interest (AOI) data frame. From the File menu, select Add Data from Resource Center. That data will come from ArcGIS Online. Your default Web browser will take you to a set of Web service layers. Click World Street Map and, if asked, choose to open rather than save the layer file. If you're not sure where to find Santiago, just click the Find tool on the Tools toolbar. On the Places tab, type "Santiago" into the Place Name field, select Large Non-U.S. Cities next to Place Type, then click the Find button. Right-click the first result and select Zoom To. To make your extent rectangle visible for this example, you'll need to zoom out to a smaller scale. From the Scale box on the Standard menu, click the drop-down arrow and type in 3,000,000.
Now you will create an overview data frame by selecting Insert > Data Frame. Rename the new data frame as South America - Overview. Right-click the World Street Map layer in the AOI data frame and select Copy, then right-click the overview data frame to select Paste Layer(s). Next, use the Zoom tool to zoom out so that the South American continent fills the map area.
 Set extent rectangle settings for the data frame. |
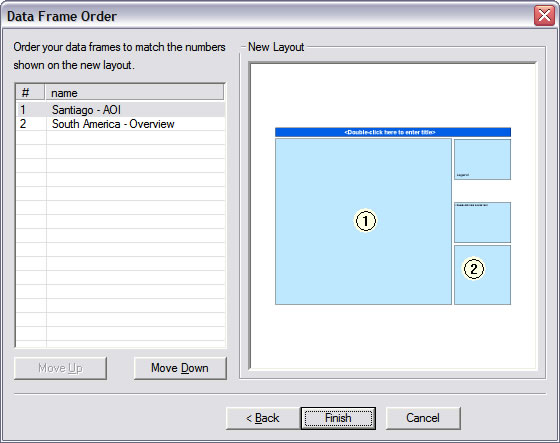
Next you'll apply a map template. You need to change to Layout View by selecting View > Layout View. On the far right side of the Layout toolbar, select Change Layout and select the LandscapeModernInset.mxt template from the General tab. Click Next and, on the Data Frame Order panel, confirm that the overview map is at the number 2 position in the lower right corner of the map. Click Finish to apply the template.
Now you are ready to apply an extent rectangle. In the table of contents, right-click South America - Overview and select Properties. On the Extent Rectangles tab, select the Santiago - AOI data frame under Other data frames and use the arrow button to move it to the right. If your map has multiple data frames that you would like to show as extent rectangles, notice that you could show those as well. You can optionally modify the extent rectangle's symbology by clicking the Frame button or add a leader line that visually connects the rectangle to its associated data frame. Click OK on the Data Frame Properties dialog box. Also add the title of the map in the placeholder in the dark blue bar.
You can now see your extent rectangle on your overview map. Try panning within your area of interest map or visiting a different place in South America. You'll see that the extent rectangle on the overview map will automatically update. This is a great technique for quickly creating a series of maps using the same layout and extent rectangle. Try using a series of bookmarks to visit each area of interest and print or export each map.