ArcWatch: GIS News, Views, and Insights
February 2012
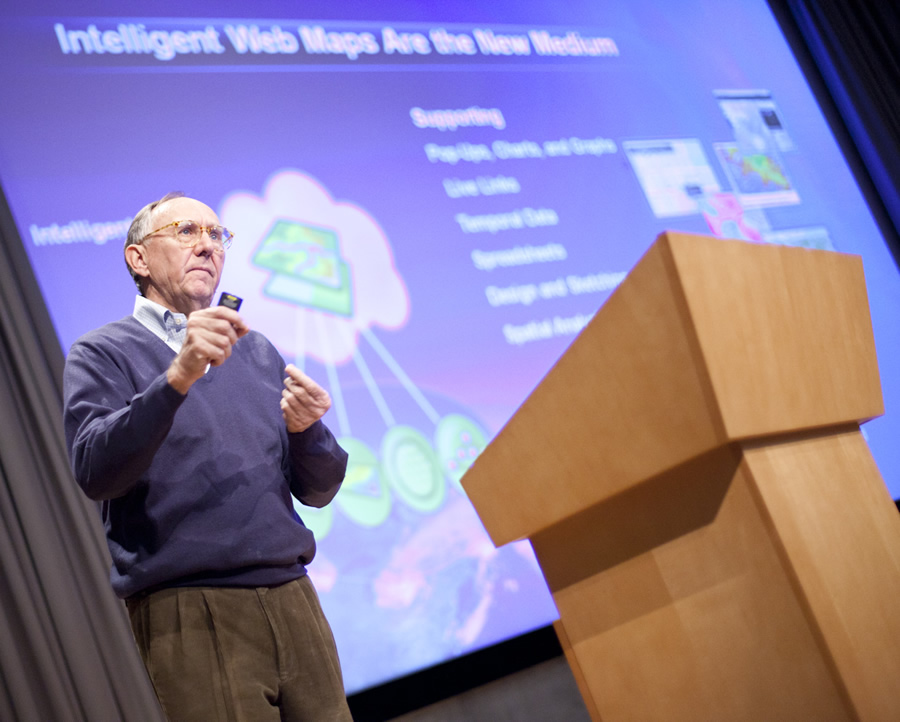
Jack Dangermond's Tips on Creating Well-Designed Intelligent Web Maps
"We need to spend more time designing maps and not just producing them," Esri president Jack Dangermond said during the recent GeoDesign Summit held on the Esri campus.
Esri president Jack Dangermond shared advice on what constitutes a well-designed map.
"Intelligent web maps are a new medium. They will be the foundation for the way information is delivered," Dangermond said. "They support analytics. They support the ability to drag data onto them. They can support sketching and sharing. They can be accessed from any device. It is very exciting to me."
However, he raised one caveat: "The problem is that most of these maps are not effectively designed."
Good maps or geoinformation products should tell an interesting story; to do that, they must be well thought through and designed. Creating great web maps takes more than mastering GIS technology. Good cartographic skills and knowing how to communicate a message clearly also are assets.
"You need to understand the issue [that] you are going to communicate," Dangermond said. "And you need to bring the appropriate data to it and do analytics and manipulation, and then come up with a compelling graphic design that helps us understand so that can support action (for) geodesign," he said.
What makes maps or geoinformation products useful and interesting? First, they should be timely. As an example, Dangermond held up a tsunami forecast map that was created immediately after the magnitude 9.0 earthquake in Japan last year by a user at the National Oceanic and Atmospheric Administration.
He said the map showed the hourly forecast for when the tsunami's waves were projected to arrive at different locations across the Pacific Ocean. The map was used in Hawaii to warn residents and business owners near the shore.
Good geoinformation products also should disseminate knowledge, communicate importance, illustrate change and show status, performance, and/or situational awareness, Dangermond said. Doing all this will support decision making and help us better design the future, he said.
To see examples of well-designed maps that tell timely and interesting stories, visit Esri's Storytelling with Maps. The latest maps on the site focus on Sears and Kmart store closures in the United States, the upcoming US presidential election, and the explosion of cellular phone use worldwide.