Hit the Slopes! Investigate Ski Areas with GIS in this Downloadable Lesson
By Joseph Kerski, Education Manager, Esri
GIS is an excellent tool for teaching spatial concepts while focusing on interesting topics in real places. For example, have you ever thought about the spatial pattern of ski areas? Ski areas, by their very nature, are spatial phenomena. Their existence depends on the global climate as well as regional and local weather patterns.
The skill level required and the excitement of different ski runs depend on the local terrain. Most ski areas have turned into year-round resorts, spawning development and changing the local economy and even the economies of entire regions. Many are on forested and fragile mountain lands, altering the habitat, vegetation, soils, and drainage of their ecosystems. Skiing, like playing golf and other recreational activities that require large amounts of land, has its proponents and opponents, and discussing these issues makes for excellent debates in geography and GIS classes. We've created an ArcLesson to do just that. You can download the lesson. The lesson includes Colorado ski area data, too.
Modeling ski areas inside a GIS offers an opportunity to investigate key spatial questions:
- Why are ski areas across the state of Colorado clustered where they are?
- What factors are important considerations in the location of ski areas?
- How many of those factors have a geographic component?
A map of Colorado ski areas in ArcGIS, shown on the right, was created from public domain data sources. The shaded relief is a 200-meter-resolution image from http://nationalatlas.gov, clipped to the state of Colorado, with highways from the Colorado Department of Transportation, rivers from the Colorado Division of Water Resources, counties from ArcLessons, and ski areas from the U.S. Forest Service.
All datasets were reprojected into the shaded relief image, Lambert Azimuthal Equal Area. Annotation was created for the ski area labels so that they could be moved off the ski area boundaries for increased flexibility and legibility.
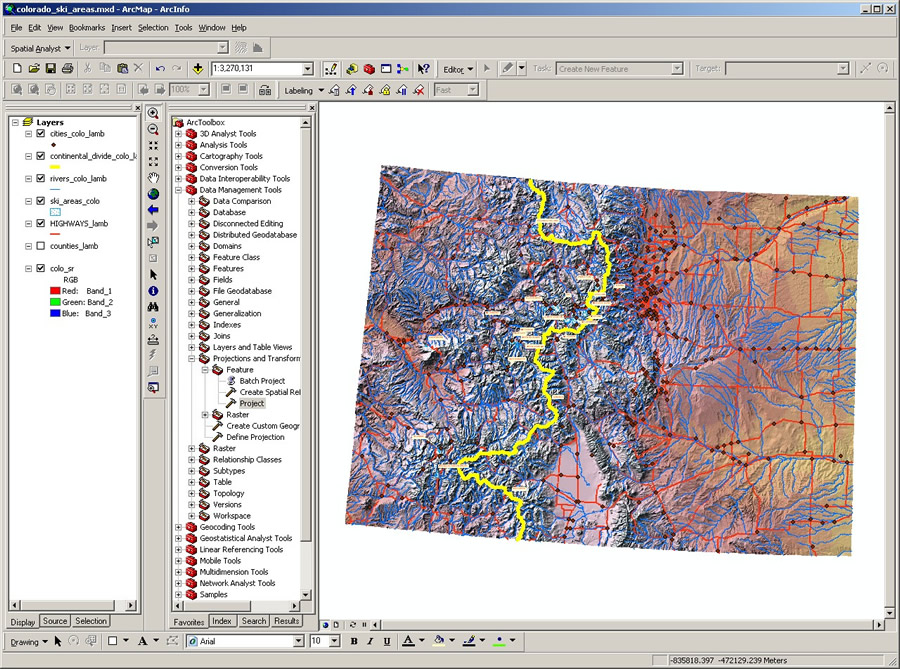 Public domain data can be analyzed in ArcMap to study Colorado ski areas. |
Select and zoom to Arapahoe Basin, where the East Wall offers the highest skiable terrain in Colorado. The resort is often open until early June. How far is this ski area from the Continental Divide? Buffer the Continental Divide by 50 miles. How many Colorado ski areas are partially or wholly within this 50-mile buffer? Why? Use the measurement tool in ArcGIS to determine the closest ski area to metropolitan Denver. Which one is it? Next, apply a 100-mile buffer to Denver. How many ski areas are within 100 miles of Denver? How many ski areas are within 100 miles of Aspen? What percentage of Colorado ski areas are along Interstate Highway 70? What impact does this have on traffic congestion along the highway? On which other highways would you expect to encounter ski traffic? If a traffic jam occurred on the highway to your favorite ski area, what are the alternate routes? What are the problems associated with alternate routes in mountainous terrain?
Where is the highest concentration of ski areas in Colorado? Draw a 50-mile or 50-kilometer buffer around each ski area. Which ski area is closest to the greatest number of other ski areas? Why do you suppose that some mountain ranges have no ski areas? Which ones are they? If you were planning a new ski area, where would you locate it and why? What sort of considerations (forest permits, road access, snowfall, and others) would you have to grapple with?
 The direction that ski areas face and their proximity to the Continental Divide can be assessed in this map of central Colorado ski areas. |
Examining the spatial pattern of ski areas is also valid at a larger, zoomed-in scale: What type of terrain are ski areas on? What direction do most ski areas face? Turning on the rivers layer will help differentiate ridges from valleys and therefore indicate the direction of slope.
In the northern hemisphere, north-facing slopes receive fewer direct rays from the sun and thus retain snow longer, making them ideal ski slopes. This discussion incorporates Earth-Sun relationships into the GIS-based activity.
However, interesting exceptions often exist when using real-world data. Why do some areas such as Arapahoe Basin, Breckenridge, and Crested Butte face a direction other than north? Do any ski areas face due south? If so, do their higher elevations and colder temperatures compensate for the increased solar radiation, or do you think there are other factors involved?
Because ski areas are 3D phenomena, taking advantage of the 3D capabilities of ArcGIS Explorer is another excellent tool to spatially analyze ski areas. Use the ArcLessons link above to download and open colorado_ski_areas.nmf inside ArcGIS Explorer. Looking south, the white outlines of Aspen Mountain, Aspen Highlands, Buttermilk, and Snowmass are visible. It shows that all four are predominantly north-facing ski areas.
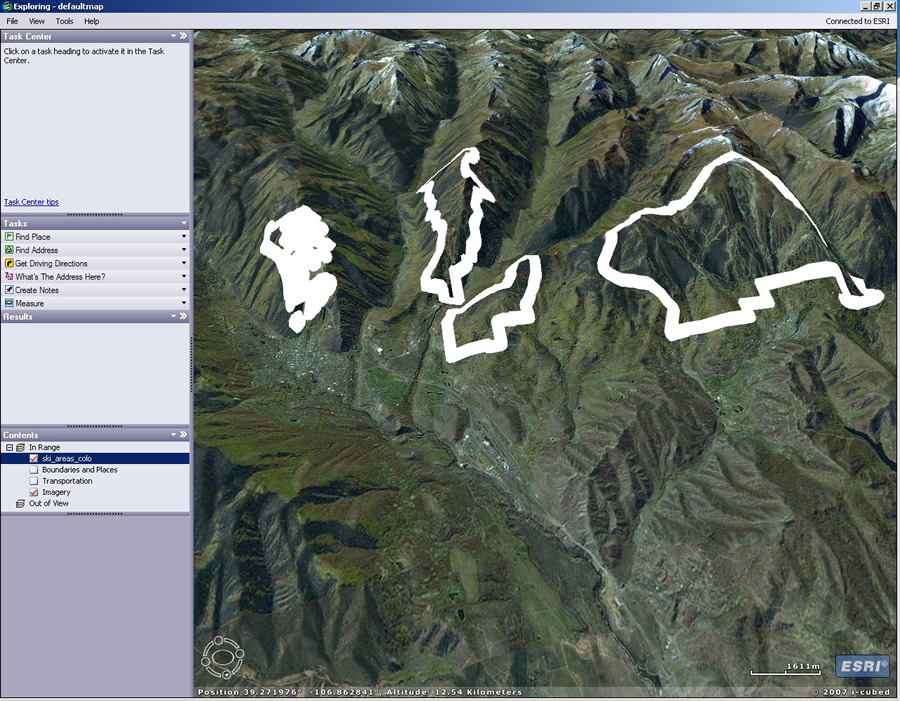 The north-facing slopes of Aspen, Buttermilk, and Snowmass ski areas are obvious after displaying the ski area data within ArcGIS Explorer. |
Which area appears to be largest? Identify each one and compare your visual assessment to the number of acres in the attribute table. Was your visual assessment correct? Which area looks like it has the largest vertical drop? Compare it to the elevation and vertical drop data for selected ski areas at www.how2ski.com.
Use the form on www.onthesnow.com to analyze whether the vertical drop distance influences the percentage of beginner, intermediate, and advanced ski runs that a resort has and, if so, how and why. Examine the annual snowfall in conjunction with your maps. Which resort listed receives the highest amount of snowfall, and where is it located within the state? Next, examine an image from a Web camera to visualize the ski resorts that you have been exploring.
With nearly 39,000 acres, Colorado has the most skiable terrain of any state or province in North America. In ArcGIS, sort the ski area attribute table on the acres field. Does the name of the largest ski area surprise you? Interestingly, Aspen Mountain comes in as the smallest. However, go back and examine the map. Which adjacent areas increase the combined skiable terrain near Aspen?
With minimal effort, rich datasets can be used to investigate spatial patterns with GIS. Try this with other states and regions of the world. After your GIS analysis is done, get out there and hit the slopes! But remember to bring your GPS so you can map your ski runs later!