ArcWatch: Your e-Magazine for GIS News, Views, and Insights
March 2011
Visualizing Bike Journeys in London Using a Concoction of R and Esri's ArcGIS
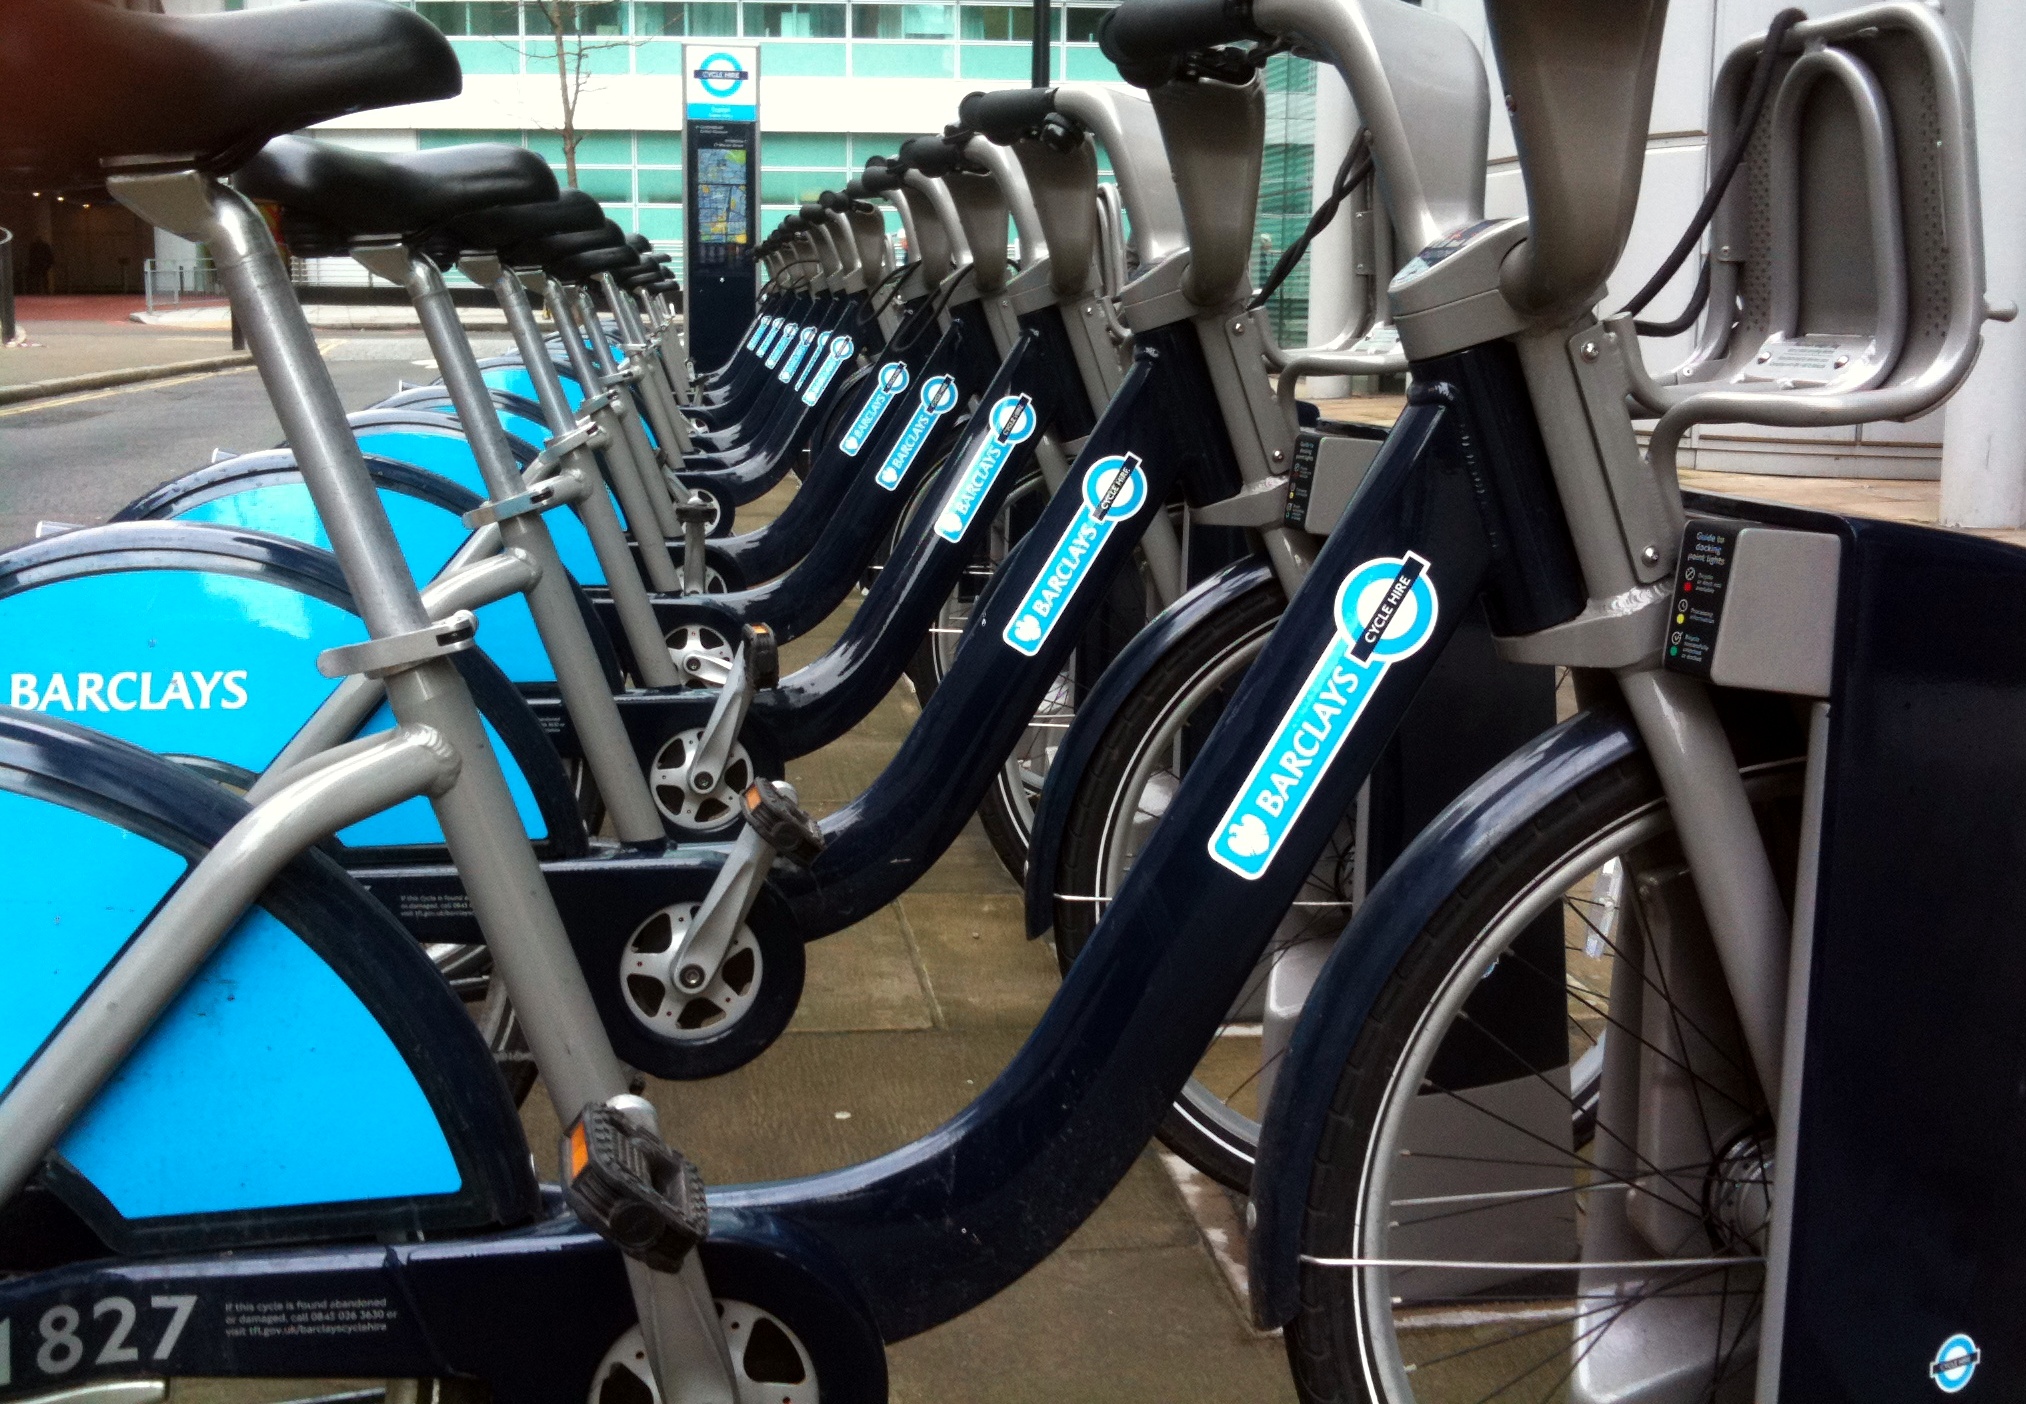
People rent the Barclays Cycle Hire bikes at docking stations throughout London. Photo by James Cheshire.
Every day, tens of thousands of people in London, England, mount sturdy navy blue and silver bicycles offered for rent by Transport for London (TfL) and pedal to work, university, tourist attractions, stores, and pubs. It's part of an ecofriendly initiative to get commuters and tourists out of vehicles such as cars, taxis, and buses and onto a greener, cleaner form of transport.
The program, officially called Barclays Cycle Hire, operates about 6,000 bikes and generates ridership in the city of London and most boroughs. Some Londoners have nicknamed the Canadian-made cycles "Boris Bikes," after Mayor Boris Johnson, a cycling enthusiast who often ballyhoos the program on television and the Internet.
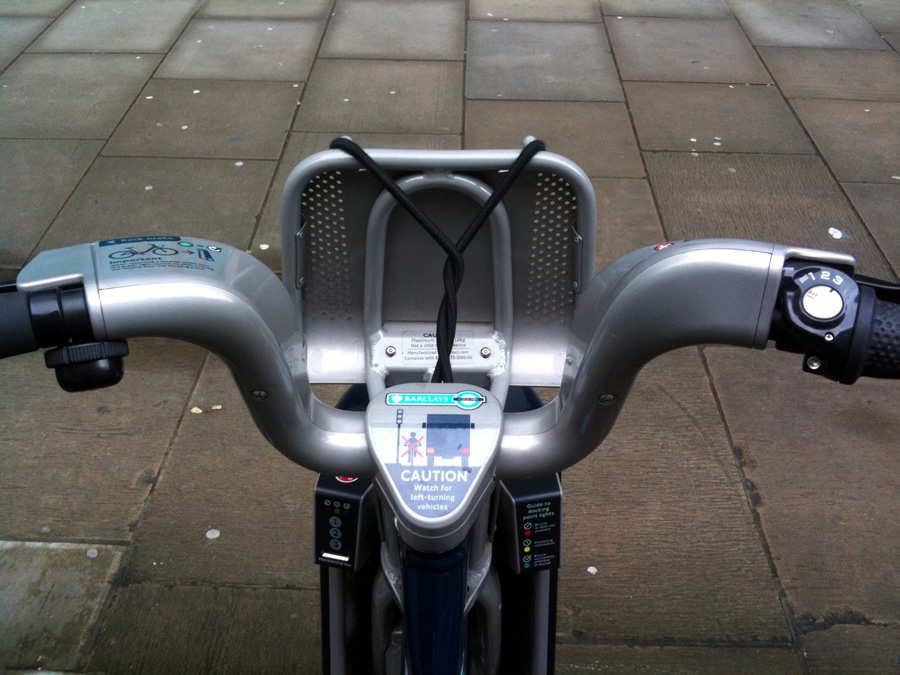
The sturdy, 3-speed bikes are manufactured in Canada. Photo by James Cheshire.
People rent the bicycles at docking stations in places like Soho, Chelsea, and Hyde Park, either by prepaying an access fee (�1 per 24 hours) and receiving a key to any bike or by paying with a debit/ credit card at the station. The first 30 minutes of a trip are free, with a sliding scale of rates kicking into gear after an hour's journey. Riders have made more than two million trips on the public bicycle transport system since the start of the program last July, according to British media.
As an Esri (UK) Ltd.-funded student at University College London (UCL), James Cheshire was curious to find out where in the city the Boris Bikes riders were taking long trips versus short ones by using spatial analysis. "We are kind of keen cyclists in our office," said the 24-year-old researcher, who will soon earn his PhD in spatial analysis and has collaborated with National Geographic on this surname map.
Mixing the R Programming Language and ArcGIS
Using data from 1.4 million journeys and what he calls a "cocktail of R and ArcGIS 10," Cheshire created a visualization of the average relative duration of weekday Boris Bikes trips over a four-month period, as shown in a 38-second video. Watch the video.
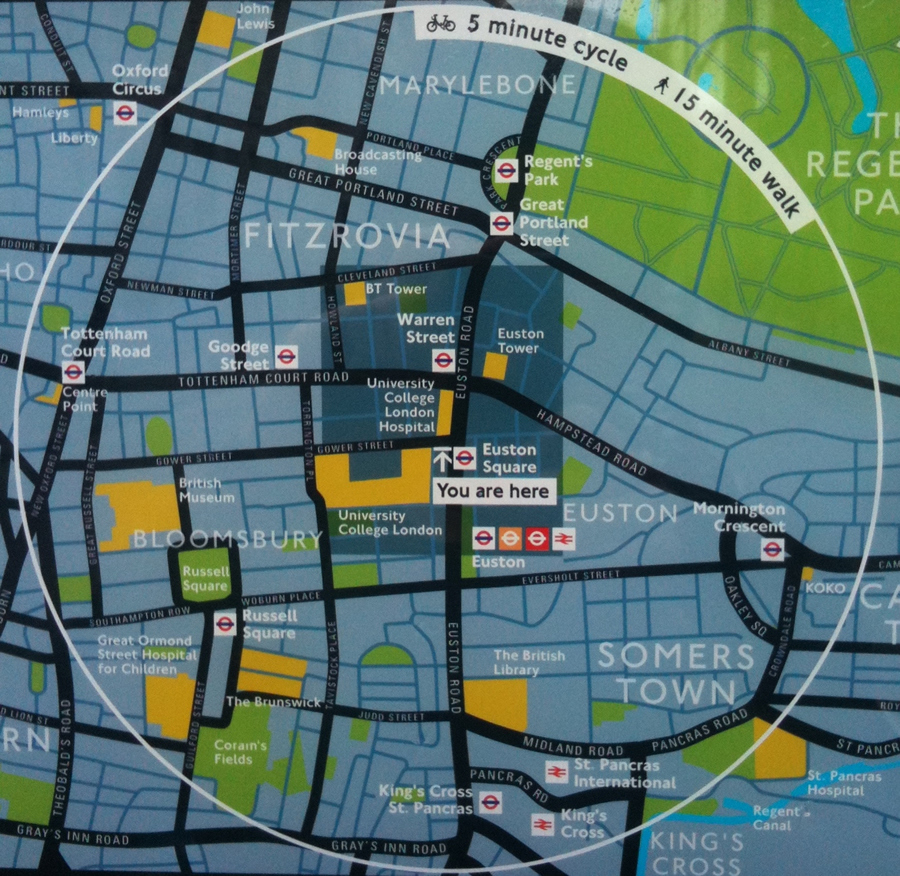
A map for the cyclists. Photo by James Cheshire.
The Barclays Cycle Hire Journey Times visualization took into account all trips between 6:00 a.m. and midnight Mondays through Fridays between July 30 and November 3, 2010, except for rides longer than one hour. The raw data came from TfL via London Datastore and includes the departure and arrival times at docking stations for each bike, said Cheshire, based in the Department of Geography and Centre for Advanced Spatial Analysis at University College London.
The R statistical programming language, maintained by the open source R Project for Statistical Computing, has a growing set of advanced spatial analysis and data manipulation functions. These can be integrated with the powerful analysis and visualization tools available in ArcGIS 10 via Python.

In the early mornings, Barclays Cycle Hire riders in central London tend to take journeys of 10 minutes or less.
For this project, Cheshire used R for the initial data manipulation and cleaning. This required calculation of the average journey duration at hourly intervals across the time period. The result was 13 averages (one for each hour) for each of the 350 docking stations (shown as crosses in the visualization). The locations of the docking stations and their average journey durations at each time interval provided the input data to create a surface for each of the 13 averages. The data contained the duration of each bike's journey between its origin and destination docking stations. It was therefore straightforward to calculate the average journey time for every bike that left a docking station within each hour. In this example, R's inverse distance weighting (IDW) function was used, but the IDW tool in the ArcGIS Spatial Analyst toolbox would have produced a similar outcome. Each of the 13 surfaces was saved as ASCII grids and easily visualized in ArcGIS 10. This enabled the addition of OpenStreetMap cartography from ArcGIS Online as a basemap for the surfaces as well as the usual map annotations. The final maps were exported as high-resolution images to be used in the animation.
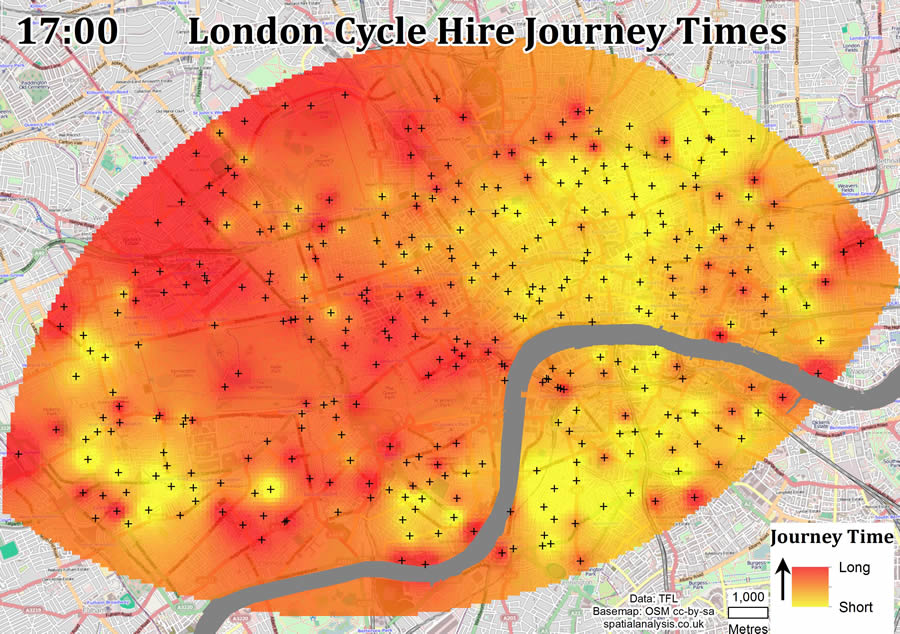
By 5 p.m., the average duration of the bike trips in central London's entertainment districts get longer. Red on the map shows where journeys are averaging more than 10 minutes.
The red color in the video indicates journeys averaging 25 to 30 minutes, while the bright yellow color shows trips averaging less than 10 minutes, Cheshire said in a recent telephone interview from London. In the early mornings, red dominates neighborhoods to the west of central London, such as Notting Hill, St. John's Wood, and Hyde Park, as commuters begin to make their way to work or school in central London. At the same time, shorter trips are more prevalent in the central part of the city, including Covent Garden, the area around City University, and Fleet Street. But in the evening, as people leave work and school, central London's West End goes from yellow to dark red. By 11:00 p.m., the spatial analysis shows the red pattern becoming more pronounced.
"That is Covent Garden and Soho, which are entertainment hot spots," said Cheshire, who theorizes that pub hopping plays a role in tacking time onto the nighttime journeys. "Perhaps people have had a couple beers and are taking longer to get home," he said. Read more about his analysis at Spatial Analysis, Cheshire's research blog.

On his Twitter account, James Cheshire says he has a "passion for all things spatial."
Cheshire said that some of the shorter morning trips in central London are being made by people who commute to London by train and then rent a bike to get to work or school. He explained how his brother, who lives outside the city with his parents but attends school in London does just that. Rather than walking to the university from the train station, Cheshire's brother hops on a Barclays Cycle Hire bike for a 10-minute ride to classes. "Cycling is by far the quickest way to travel in London," said Cheshire, a proponent of the Barclays Cycle Hire program. "London is congested, so the more [the city] can get people to bicycle, the better."
Cheshire was named Outstanding Student of the Year at the UCL Department of Geography Esri Development Centre. He received the honor from Esri president Jack Dangermond at a ceremony last spring.
Contact Cheshire at james@spatialanalysis.co.uk.