ArcWatch: Your e-Magazine for GIS News, Views, and Insights
March 2011
Midwest Education Atlas Website Launched
Regional Educational Laboratory Midwest Creates Maps Using GIS That Provide Insights into Educational Issues and Challenges
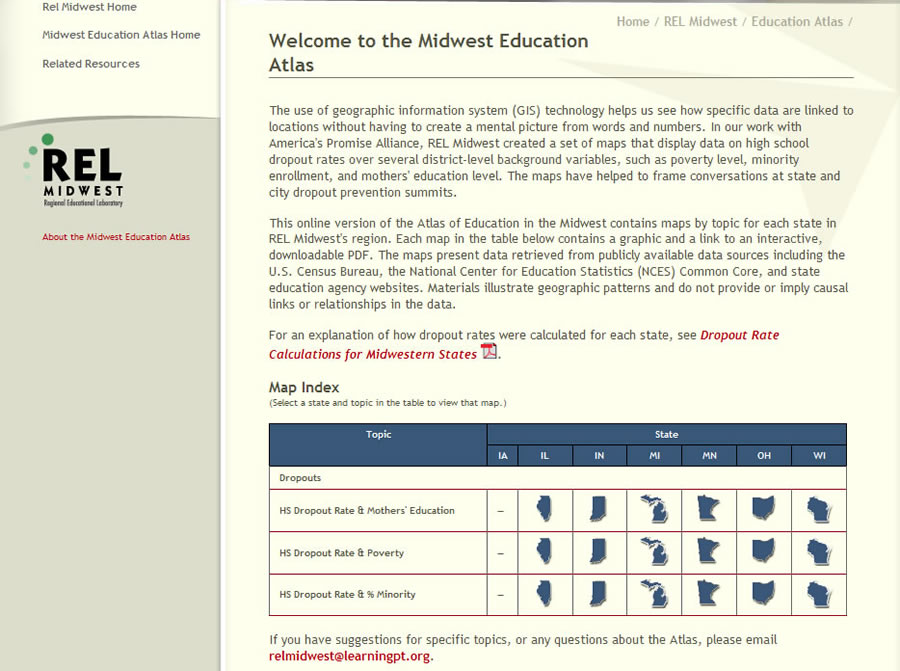
You can view the REL maps by visiting the Midwest Education Atlas homepage.
More educational researchers are turning to GIS to analyze important questions such as what's driving high school dropout rates, low test scores, and differential school performance on state tests.
For example, Regional Educational Laboratory (REL) Midwest recently launched the Midwest Education Atlas, an online repository of geographic data displays that maps out the most recent data on high school dropout rates and gives educators a different perspective on how to prevent students from leaving school before they graduate. Esri's ArcGIS software was used to create the maps.
GIS has long been used to conduct a wide range of analyses and create myriad data displays in many fields and disciplines such as urban planning, cartography, marketing, sales, and other business planning endeavors. However, in the field of education research, using GIS technology is still a relatively new methodology for examining data.
GIS technology offers a reliable method for analyzing and displaying complex, geographically linked educational data. When education data is displayed geospatially, patterns emerge that could easily go undetected in tabular or graphical data.
For the past few years, REL Midwest, one of 10 regional educational laboratories funded by the U.S. Department of Education's Institute of Education Sciences, has been using ArcGIS to pull together publicly available education data at the school, district, state, and regional levels to examine geographic relationships and differences in a new way.
Using GIS technology and publicly available data sources, such as the National Center for Education Statistics (NCES) Common Core of Data, state education agency websites, and the U.S. Census Bureau, researchers can see where the schools within high- and low-performing districts are located and easily detect low-income school districts and high- and low-performing schools within these districts. For example, poverty can be displayed at the county level by using income-level information from the census.
The percentage of students eligible for free and reduced-price lunch (available through the NCES Common Core of Data) can be used as a reliable indicator of school and/or district poverty. School performance data can be easily mapped using publicly available state test scores or Adequate Yearly Progress (AYP) indicators. When combining layers such as these at the school, district, state, and regional levels, an interesting and easily digestible picture starts to develop. Materials illustrate geographic patterns and do not provide or imply causal links in the data.
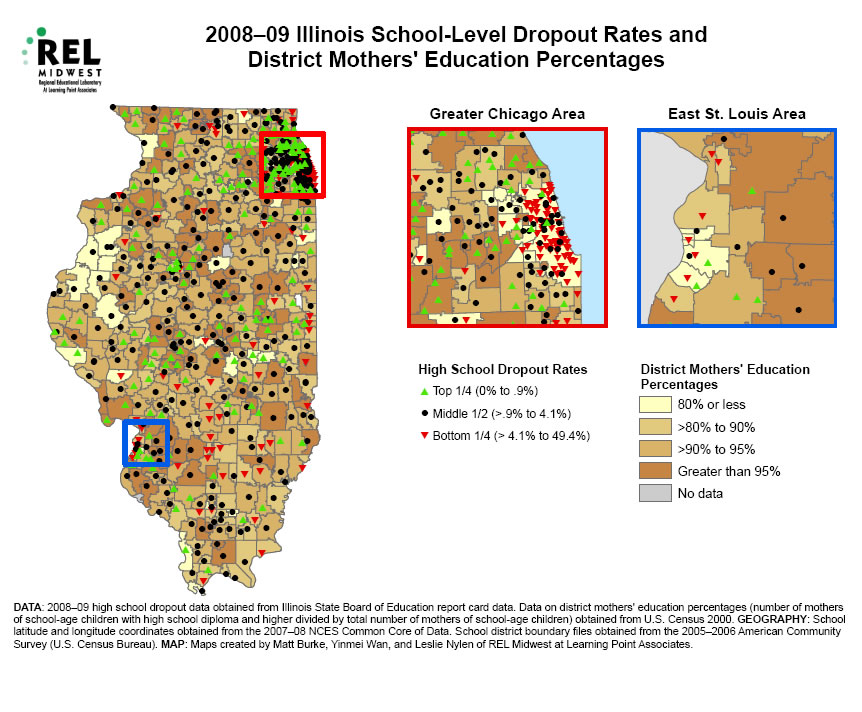
The Regional Educational Laborary (REL) Midwest maps high school students' drop out rates along with education percentages of mothers who have school age children.
REL Midwest serves educators and educational policy makers in Illinois, Indiana, Iowa, Michigan, Minnesota, Ohio, and Wisconsin. A nonpartisan resource, REL Midwest provides expert advice to help them apply scientifically valid research to their decision making.
For the Midwest Education Atlas, data was first gathered from publicly available sources. Then the REL Midwest team used ArcGIS to create a set of maps that displayed data on high school dropout rates, along with data on poverty levels, minority enrollment, and the percentages of mothers who earned a high school diploma or higher.
These dropout rate maps were created based on REL Midwest's support of statewide and citywide summits on high school dropout prevention and have helped frame conversations on dropout prevention with policy makers in communities across the Midwest.
"Like all states, Midwest states are focused on improving graduation rates and reducing the number of students who drop out of school each year," said REL Midwest director Matt Dawson. "State initiatives like Every Child a Graduate in Wisconsin and the Superintendent's Dropout Challenge in Michigan underscore the importance of this issue throughout the region." In her work with the dropout prevention summits, REL Midwest senior policy associate Sara Wraight noticed that policy makers and practitioners were very interested in data presented in map form. "The maps generate conversation," she said. "People seem more readily drawn to information when they can see places they know."
On the Midwest Education Atlas site, maps for Illinois, Indiana, Michigan, Minnesota, Ohio, and Wisconsin display the most recent data on high school dropout rates. Each map contains a link to an interactive, downloadable PDF that allows users to hide or show various layers of information and zoom in or out on specific regions in the state.
REL Midwest plans to release additional maps of other educational data on a quarterly basis. Among the topics in review are state student achievement data, school funding and finance, and differences in performance and related variables in urban versus rural areas and schools. The organization's staff continually discovers new applications for GIS in their work and new techniques to utilize in analyzing and interpreting educational data. The atlas website is in its infancy, mainly focusing on data display. But REL Midwest anticipates adding more functionality as time progresses. Currently, the Midwest Education Atlas is primarily being used by education stakeholders who have preexisting relationships with REL Midwest, such as state policy makers, practitioners, and department of education staff. As more and more data is incorporated and displayed on the Midwest Education Atlas site, REL Midwest aims to incorporate ArcGIS Server functionality to provide a fully customizable user experience in which anyone—including researchers, teachers, and parents—can access and display data unique to their state, district, or school.
The organization hopes that over time, as more users become interested in the project and more data becomes integrated into the maps, the site will evolve into a fully customizable and interactive web experience that can help students, parents, researchers, administrators, and policy makers make more informed decisions and thereby collectively improve the education system as a whole.