ArcWatch: GIS News, Views, and Insights
March 2012
Learn a New Method for Displaying Hillshades and Elevation Tints
It is quite common to find maps on which a hillshaded surface is overlain with a transparent colored thematic layer. The thematic layer could be soils, land use, vegetation, or other types of phenomena, but it is often elevation (figure 1). Using what is called an elevation tint, ranges of elevation are assigned different colors that mimic what you might see on the ground. Greens in the low-lying valleys transition smoothly to light browns at the lower rocky elevations, which blend into darker browns in the higher treeless areas, and finally change to white on the snowcapped peaks.
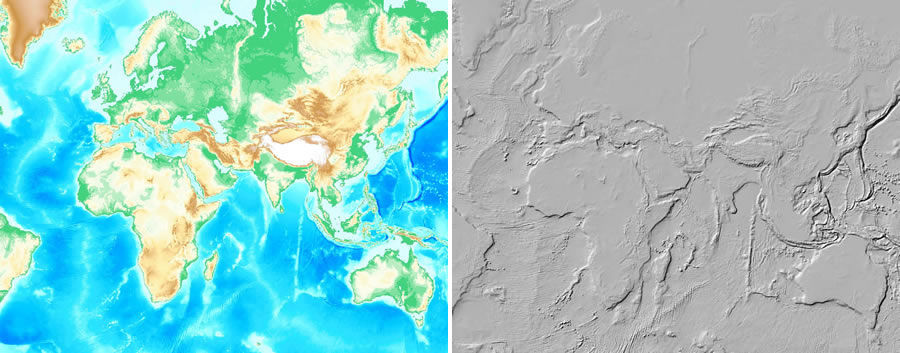
Figure 1. An elevation tint (left) is often overlaid transparently on a hillshade (right).
This is a great way to display elevation over hillshade, but a couple of serious problems often arise: the gray in the hillshade mutes the colors of the elevation tint, and the detail in the hillshade becomes obscured by the overlaid theme (figure 2).
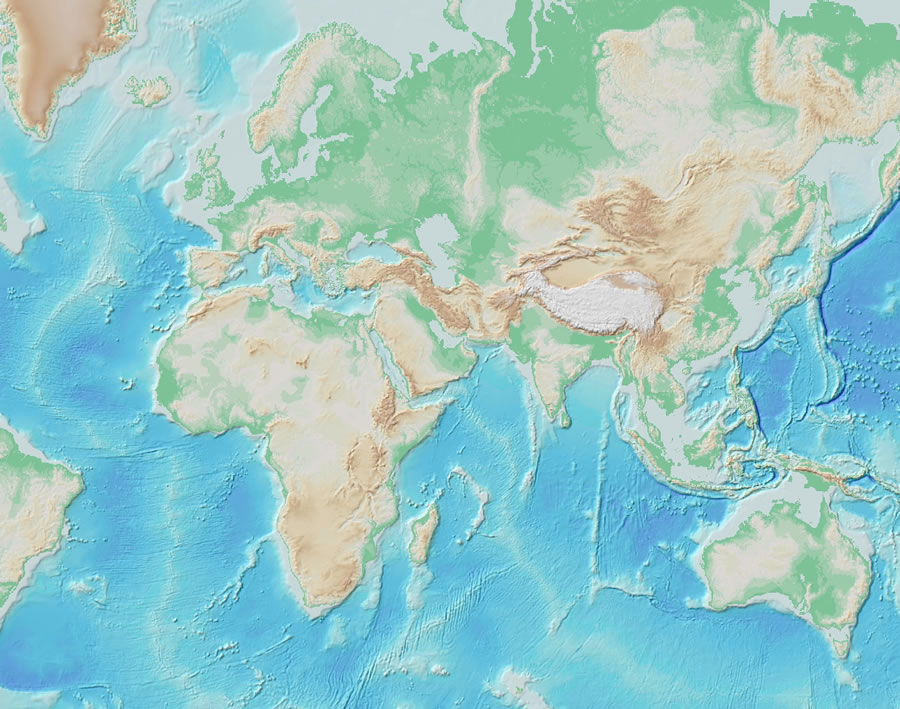
Figure 2. When the layer tint is overlaid on the hillshade with 50 percent transparency, the colors of the elevation are washed out, and the hillshade's details are obscured.
By using a set of functions for displaying raster data in ArcGIS 10 for Desktop, you can easily display colored tints on hillshades without losing the original colors and the hillshade details (figure 3).

Figure 3. Using raster functions, an elevation tint and a hillshade can be combined to retain the original colors and all the detail.
Combining the layer tint and hillshade to create the desired result involves specifying a set of functions for a mosaic dataset. You can specify these functions once you have created and added data to a mosaic dataset. When defining functions for a mosaic dataset, you will add new functions to the previously defined ones. They will appear in the Mosaic Dataset Properties dialog box on the Functions tab. The most recently defined function will appear at the top. The final function chain for the method described here for displaying an elevation tint and hillshade will look like the one in figure 4.
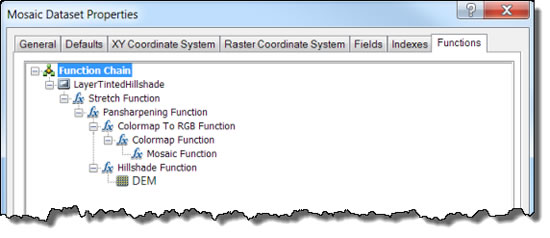
Figure 4. The Final Function Chain
Step 1. Make sure that the data is all positive values. If you already know your data contains no negative values, go to step 2. Otherwise, in ArcCatalog, right-click the mosaic dataset and click Properties. On the Functions tab, right-click Mosaic Function > Insert > Arithmetic Function. Set Operation to Plus, set Raster to Raster 2, and set the constant to the absolute value of the lowest number in your dataset (for example, if the lowest value is 12,000, set the constant to 12000). In ArcGIS 10.1, you will also be able to use data with negative values, so when you upgrade to the new version, you can skip this step.
Step 2. To use the color map function in step 3, you must make sure that the data is defined as 16-bit unsigned. In ArcCatalog, right-click Mosaic Function (or, if you performed step 3, right-click Arithmetic Function) and click Properties. On the General tab of the Raster Function Properties dialog box, change Output Pixel Type to 16 Bit Unsigned if it is not already set to this. Click OK.
Step 3. Apply the color map function. A color map is a text file that contains a color specification for each elevation value. On the Functions tab, right-click Mosaic Function > Insert > Colormap Function. Browse to the color map file. (You can download a color map file for ETOPO1 and other elevation data from the Esri Mapping Center. Note that all values in the color map file must be positive. If they are not, edit the file by adding the same constant used in step 1 to all values.) Click OK.
Step 4. Convert the single-band raster to a three-band raster so that you can use the pan-sharpening function later in this process (step 8). Right-click Colormap Function > Insert > Colormap To RGB Function. Keep the default value.
Step 5. Make sure the data is defined as 8 bit unsigned so that you can use the pan-sharpening function in the next step. On the General tab, change Output Pixel Type to 8 Bit Unsigned. Click OK.
Step 6. Apply the pan-sharpening function. On the Functions tab, right-click Colormap To RGB Function > Insert > Pansharpening Function. For panchromatic, select the hillshade, if you have one. If you do not, select the DEM. Change Method to Simple Mean. Keep the rest of the defaults and click OK.
Step 7. If you did not select a hillshade in the previous step, right-click DEM > Insert > Hillshade. Keep the defaults and click OK. If the data is in a geographic coordinate system, change the Z Factor. (Refer to the Esri Mapping Center blog "Setting the Z Factor Parameter Correctly" for a list of Z factor values.)
Step 8. Apply the stretch function. Right-click Pansharpening Function > Insert > Stretch Function. Change Type to Minimum-Maximum. Check the Use Gamma option. Input 0.5 as the Gamma value for bands 1, 2, and 3. Input 10 and 220, respectively, as the Min and Max Statistics values for each of the three bands. (After you have checked the results, feel free to experiment with the Gamma, Min, and Max values in the stretch function.) Click OK.
Step 9. To see the results, click OK. If you do not see any results it is probably because the pixel sizes are not within the minimum-maximum that are automatically set for the mosaic dataset. To correct this in ArcMap, right-click Footprint in the table of contents > Open Attribute Table, right-click the MaxPS field, and click Field Calculator. For "MaxPS =", input [MaxPS] * 10000 and click OK. (For more information about what scalar value to use in this equation, read the online help topic Cell size ranges in a mosaic dataset.) Close the attribute table.
Using the steps above, you will see results that are much closer to your original data than using the more common transparent overlay method. With this new technique, your original colors will be sharp and brilliant, and your hillshade will convey the detail you originally wanted to show. Even though this method requires a few additional steps, the outcome is worth it for this reason alone. But you will also save time by not having to adjust the transparency values to find a good result with the overlay method. Now you don't have to imagine how to compensate for those shortcomings—you know that the colored raster and the hillshade that you input will be shown exactly the same way in the output.
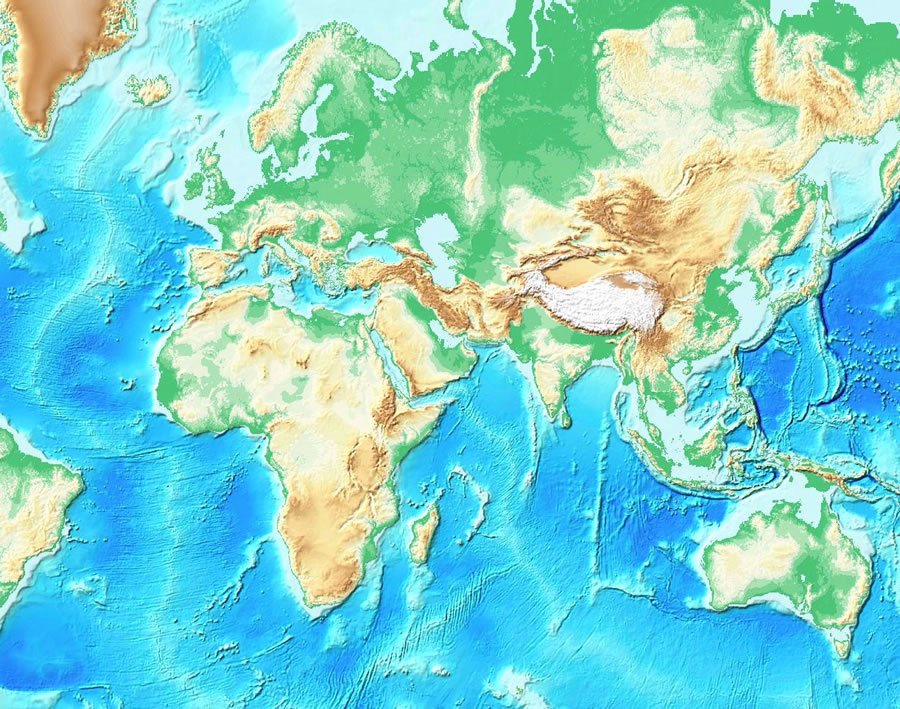
Figure 5. This method of displaying a hillshade and an elevation tint produces a result that retains the original colors and the hillshade details.
While the example discussed here is shown with a hillshade and an elevation tint, you can use the same method to display any colored raster along with any grayscale raster. Consider that this method could also be used with other grayscale rasters, such as panchromatic imagery and hillshades of surfaces other than elevation (for example, a density surface). When you overlay your colored layer on them, you will get the same results—the detail in your grayscale raster and the colors you originally selected.
Try this yourself and see how easy and useful this is!