GIS Plays Growing Role in Monitoring and Limiting the Impact of Visitors to Oregon Caves
By Elizabeth Hale, U.S. Department of the Interior, National Park Service, Oregon Caves National Monument
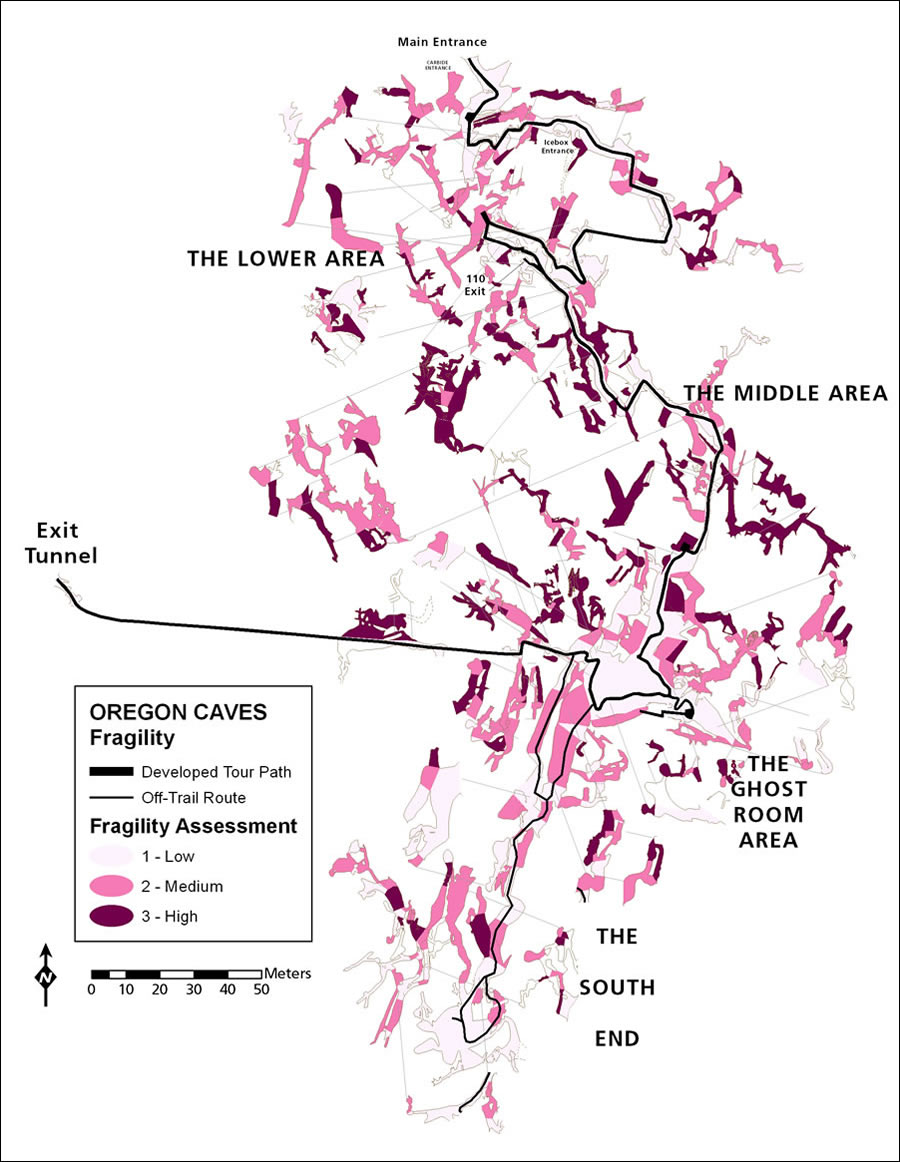 The fragility, or vulnerability to damage, of cave passages in Oregon Caves was systematically assessed based on a combination of factors, including the condition and value of the resources in that passage, the proximity of human visitors in that passage to fragile resources, and the density of breakable formations present. | |
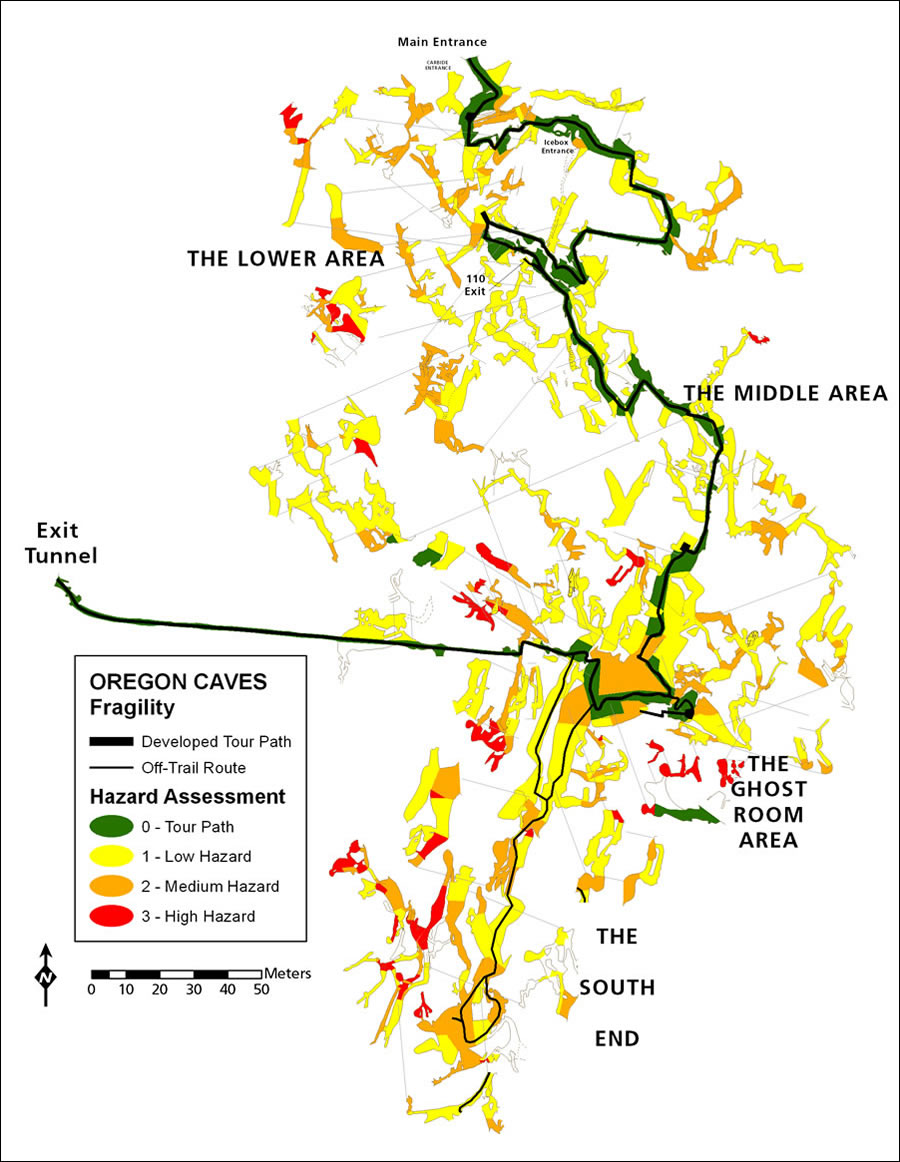 The hazard of cave passages in Oregon Caves was systematically rated between zero and three based on criteria that included passage stability, potential falls, and caving equipment required. However, note that a rating of zero does not mean there are no hazards at all. | |
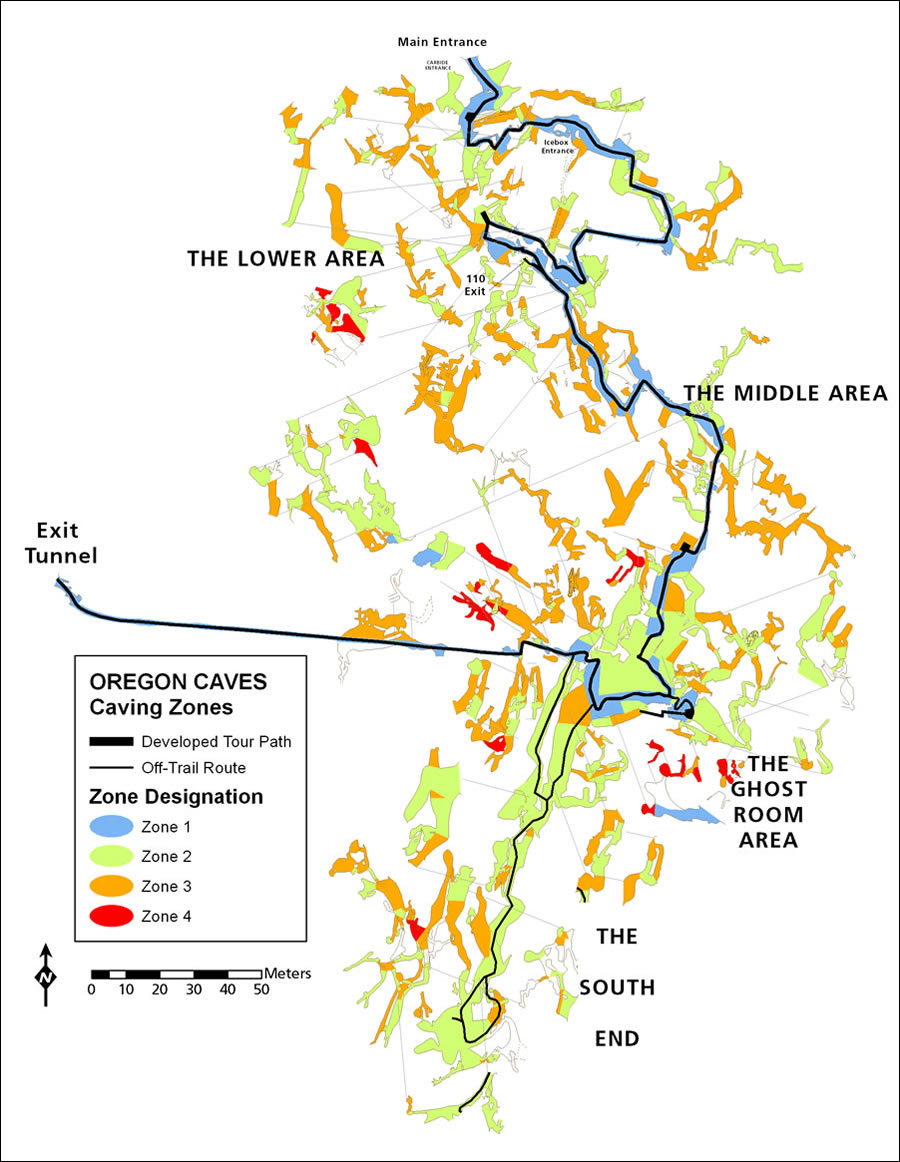 Oregon Caves' passages fall into four caving zones based on the combination of their fragility and hazard rating. These zones define requirements for obtaining permits to visit off-trail areas of the cave. |
Soda straws, stalagmites, and stalactites. Bacteria-cultured calcium carbonate called "moonmilk." Squiggly sediment patterns on rocks called "clay worms." Black bear bones.
Nature has filled Oregon Caves with many wonders to see. But visits by 48,000 people a year to the national monument, located 50 miles south of Grants Pass, Oregon, significantly impact the natural resources in the "Marble Halls of Oregon." Damage can include broken cave formations, darkened and polished rock from touching, and lint deposits. Cave sediments and animal bones also get disturbed.
Geographic information system (GIS) technology is playing a growing role in helping the National Park Service protect the cave and its resources. In the past two years, the most basic GIS layers of the cave—survey station points, survey shots (lines), and cave walls (polygons)—have been the starting point for developing datasets and maps to help visualize the cave's hazardous and fragile areas, protect paleontological resources, manage a growing collection of photos, and develop a new public off-trail caving tour.
The National Park Service at the Oregon Caves National Monument used Esri's ArcInfo and ArcPad software for its project along with COMPASS, a cave survey management software package.
Implementing a Fair System for Issuing Caving Permits
A complete cave map provides some information about potential safety hazards and the cave's vulnerability to human impact via labels for ceiling heights and pit depths and symbols for slopes and delicate cave formations. But this information can be viewed and synthesized in many ways, leading to varied conclusions about how hazardous or how fragile a particular area is.
To eliminate this kind of subjectivity when determining whether to issue caving permits, GIS was used to produce hazard and fragility maps from a criteria-based assessment to clearly and objectively display the hazardous and fragile areas of the cave.
ArcPad on a Pocket PC in a rugged case was used to conduct the hazard-fragility assessment. Based on the GIS line layer of survey shots, cave passages were attributed with a rating for hazard and fragility. Factors considered for a hazard rating included potential falls, loose ceiling rock, mazy passages, and required caving gear. Fragility was assessed as the average of four equally weighted ratings: resource condition, proximity to fragile resource, resource value, and density of breakable formations. To design hazard and fragility maps, the GIS layer of cave walls was divided into polygons to represent areas encompassed by individual survey shots, as the assessment was conducted on a shot-by-shot basis.
Combined hazard and fragility ratings were used to categorize areas of the cave into caving zones. Permits to enter areas of the cave beyond the tour path are now issued based on the requirements of the caving zone being visited, as defined by the monument's subsurface management plan.
Keeping Track of Paleontological Resources
Oregon Caves contains hundreds of animal bones, some of which are very old or fragile yet well preserved in the cool and dark passages of the cave. Significant finds over the years have included 50,000-year-old grizzly bear bones and the 38,600-year-old remains of a jaguar. Bones were inventoried in a nonspecific way in the 1990s, resulting in a rough map of where they were found throughout the cave. More recently, to improve the stewardship and knowledge of the cave's paleontological resources, a site-by-site paleontology survey was undertaken so that bones can be readily relocated and monitored.
In the subterranean passages of Oregon Caves where GPS cannot be used, survey station markers—often a labeled strip of aluminum or piece of surveyor's tape—serve as points of reference. Paleontology sites were surveyed from the nearest survey marker with a laser distance meter, compass, and inclinometer. Additionally, sites were described systematically, photographed with an object for scale, and flagged when in danger of being disturbed. COMPASS was used to create a GIS layer of paleontology sites from survey measurements. Attribute data is managed in a table that can be queried, sorted, and joined to the GIS layer.
As of mid-March 2008, more than 180 paleontology sites had been documented. Many of the bones appear to be from bats and pack rats, the two most common cave mammals. However, none of the staff who conducted the paleontology survey had a background in paleontology, so the animal origin of most bones remains unidentified.
Managing and Retrieving Photos for Monitoring
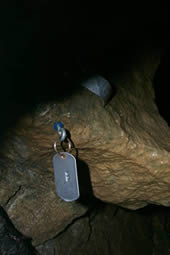
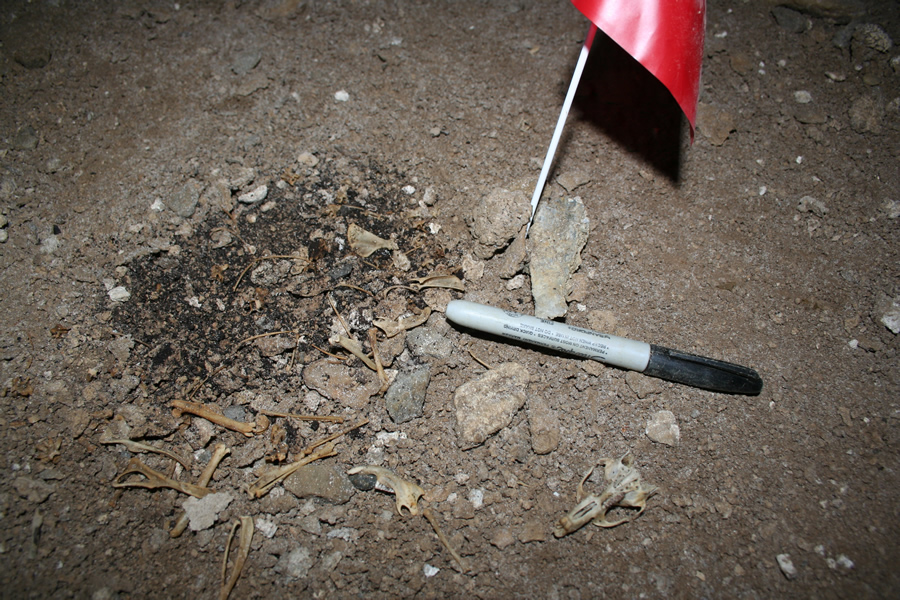 This is one of many sites that were surveyed and documented in the paleontological survey. The marker serves as an object for scale. About 20 animal bones of unidentified origin were found at the site. | |
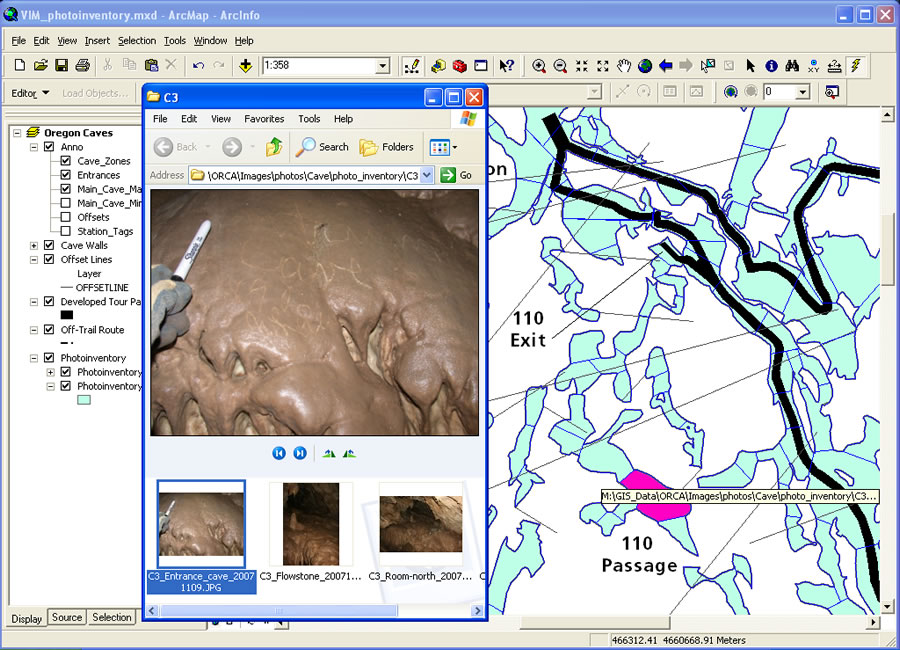 Cave photos, both scanned and digital, can be retrieved by location through a hyperlink. |
Photo monitoring is perhaps the most common approach to keep track of the impact of visitors to the cave. Photo monitoring involves repeatedly photographing a site from the same distance and angle to detect changes in its condition. There are 19 sites along Oregon Caves' tour routes that are photo monitored from fixed-point stations. However, many other sites and features of interest or concern have been photo documented casually (without a specific distance and angle), which has resulted in a larger set of photos that can become unwieldy without naming conventions and methods for retrieval.
To make the cave photo collection more usable, old and new photos were sorted by location and a GIS layer was prepared so that a wide range of photos can be retrieved by selecting any area of the cave. To do this, the photos were named according to a specific format and organized by the closest survey station marker. The GIS layer of cave walls was divided into polygons to represent areas defined by their proximity to survey station markers. Then a text field in the attributes table was set up so that when hyperlinks are enabled for this layer, photo sets can be accessed with the hyperlink tool.
GIS layers for photo-monitoring stations and paleontology sites were also set up so that photos could be hyperlinked from individual stations and sites.
Planning Low-Impact, Off-Trail Tours
In the summer of 2007, the National Park Service offered a public, off-trail caving tour in Oregon Caves for the first time. Data on the off-trail tour route was gathered from cave-resource and visitor-impact inventories as well as the hazard-fragility assessment and paleontology survey. These datasets helped identify every hazardous area and fragile resource so that each could be addressed with protective flagging, rerouting, and/or training for tour guides. The visitor-impact inventory was analyzed to predict how the caves would be affected by visitors who take the tours.
The polishing and darkening of rocky surfaces caused by touching was one expected impact. As there are many tight passages along the off-trail route, this is largely unavoidable, though all visitors wear gloves. Photos were taken to monitor polishing and darkening of several areas along the route.
Accumulation of hair was also expected to occur. People who visit the caves all leave behind some skin flakes, hair, or lint, which can build up and create unnatural deposits of organic material. These deposits, besides being unsightly, can have an ecological impact. To try and reduce the deposits, Oregon Caves gives visitors souvenir bandannas to secure loose hair.
 Survey station markers like these, each with a unique alphanumeric label, serve as points of reference in the cave for mapping and monitoring. |
Sediment disturbances were also likely to increase, including tracking sediments from one location to another and packing down floor sediments. Though the significance of these disturbances is not well understood, flagging was placed in many of the off-trail passages to limit these impacts to a clearly defined path.
Survey Station Markers Key
Survey station markers were an important component of the approach that Oregon Caves took to use GIS to help monitor and limit visitor impacts. Otherwise, a completely different scheme would have been needed to reference assessments, surveys, and photos to physical locations. The efforts described here to systematically issue cave permits, protect paleontological resources, manage photos through hyperlinks, and plan off-trail caving tours required only simple, low-labor applications of GIS that can be applied at other caves and carried out even when staff members have only a basic knowledge of GIS.
Elizabeth Hale is a physical science technician with the resource management division at Oregon Caves National Monument. Her duties include monitoring cave processes and fauna, managing GIS data, and coordinating cave cleanup and restoration. For more information, e-mail her at Elizabeth_Hale@nps.gov or visit www.nps.gov/orca.