Esri Poised to Release ArcGIS Explorer 900
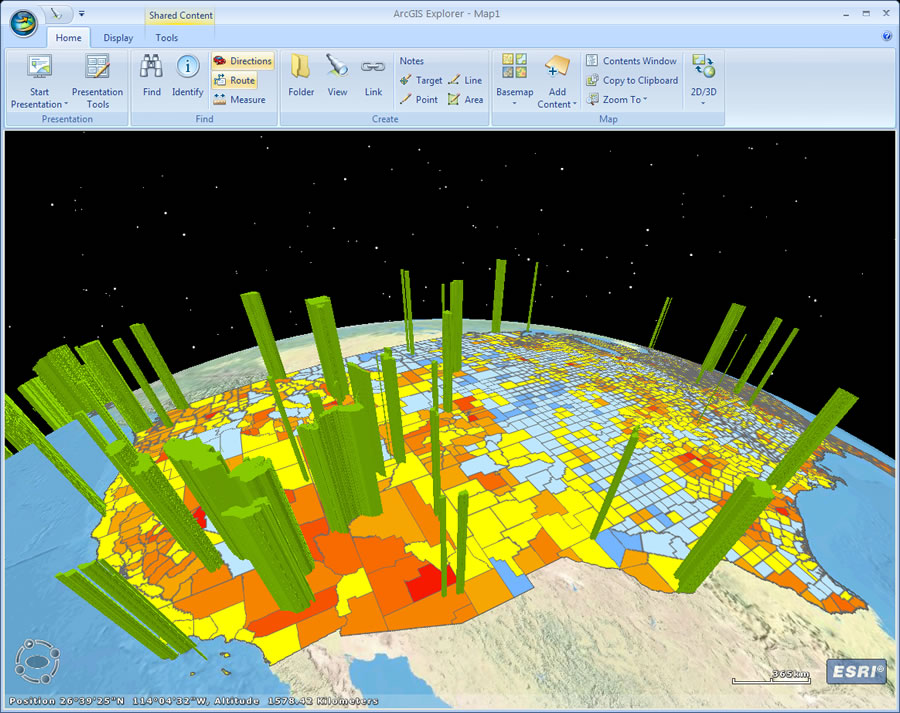 ArcGIS Explorer 900 features a new ribbon interface and tools to help you create compelling interactive presentations. |
ArcGIS Explorer 900, set for release in the second quarter of this year, will make geospatial visualization and analysis on the Web easier than ever, in 2D or 3D. The flagship geospatial visualization tool is a free, lightweight, and downloadable application that lets users query and analyze data from online sources, fuse it with their own local content, then map the data on virtual globes. The application's latest iteration will come with new presentation tools and an easy-to-use ribbon interface.
Esri continually works to improve geospatial visualization tools. Bern Szukalski has helped develop and market these tools over the past 20 years, working on teams that produced ArcView 2.0, ArcIMS, and, most recently, ArcGIS Explorer. He is currently the product manager with the ArcGIS Explorer team. Matt Artz, Esri's GIS and Science program manager, recently spoke with Szukalski about how geospatial visualization tools in software evolved at Esri and what the future holds with the release of ArcGIS Explorer 900.
Artz: Bern, what are your day-to-day responsibilities at Esri?
Szukalski: My responsibilities center on ArcGIS product management, currently focusing on ArcGIS Explorer, but on a week-to-week basis just about anything can come up. I'm definitely "old school" Esri, having arrived here when the company was much smaller. It was not uncommon then for staff to do a little of everything and cross group boundaries to form virtual teams spontaneously as needs dictated.
Artz: How do you see the role of geospatial visualization tools such as ArcGIS Explorer in the larger geospatial industry?
Szukalski: Before knowing what geospatial meant, I was employed by an environmental consulting firm. Most consulting projects culminated with a presentation of one form or another that involved displaying a map to convey information to the client or the public. We used the maps to communicate with our audience and portray what might be complex information in an easy-to-understand context. To me, those are key aspects of visualization.
Artz: We're talking about paper maps and slides rather than visualization software?
Szukalski: Back then, those were paper maps and crude ones, at that. Today we have far more vibrant, interactive, and expressive ways to visualize geographic information. Presentation and visualization are perhaps the most important aspects of the geospatial technology domain, as even the very best data or analysis that GIS can offer is no better than our ability to communicate that information broadly to our audience, using various means of visualization. Good visualization tools provide broader access to that information and increase the inherent value of that data or the results of geographic analysis. In some respects, this reminds me of looking at a compelling photo of a landscape. Through such photographs, we can communicate and increase the inherent value and understanding of the subject itself.
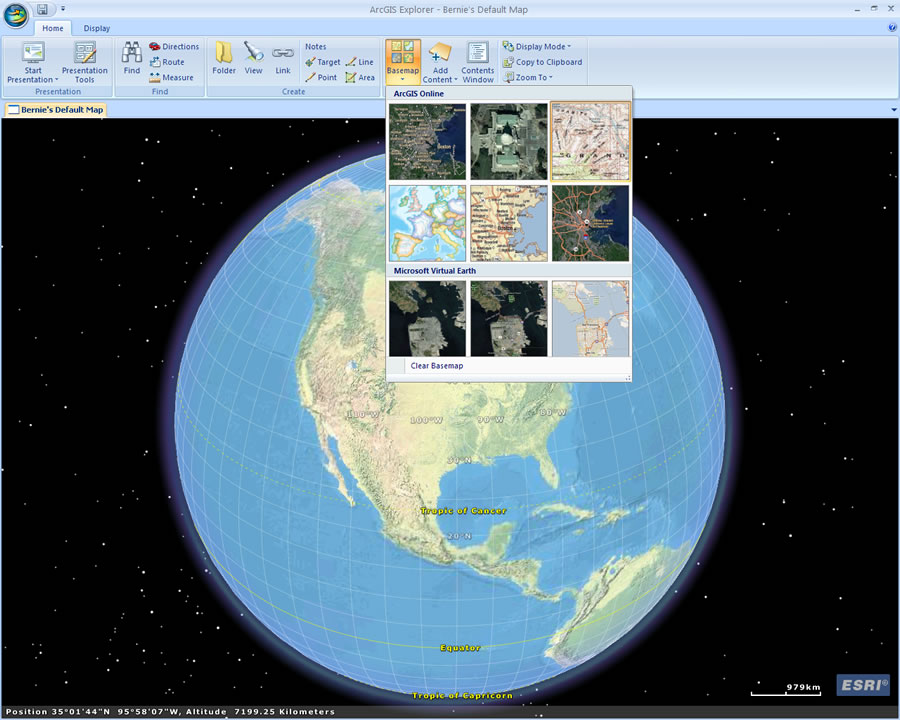 ArcGIS Explorer offers continually updated basemaps and layers from ArcGIS Online. |
Artz: Who do you see as the primary user of geospatial visualization tools?
Szukalski: Printed maps are certainly the foundation of geographic visualization, but even more compelling are the dynamic, online, interactive visualization capabilities that run the gamut from consumer applications to targeted public applications to professional GIS desktops. Somewhere in between targeted public applications and desktop GIS is a space I think of as the geographic information user. This person is not a GIS expert but someone who needs to explore, visualize, and present geospatial or GIS information along with other geographically based information like photos, GPS locations, and even documents and other forms of rich media. That's the visualization and presentation space that ArcGIS Explorer serves and continues to evolve in.
Artz: How did ArcGIS Explorer come about?
Szukalski: It was really driven by Euan Cameron and Mark Bockenhauer at its inception. They were the lead development and product engineers, respectively, on the ArcReader and ArcGIS Publisher efforts. ArcGIS Explorer evolved out of many ArcReader concepts and was also influenced by ideas introduced with other non-Esri products around that time, like the virtual globes. Some of the same drivers for ArcReader and ArcGIS Publisher became the drivers for ArcGIS Explorer, but in a different context. But clearly, it was a natural evolution of existing products and ideas with some new thinking based on past experiences and user wants and needs, and the evolving Esri product landscape, too.
Artz: When did ArcGIS Explorer appear on the scene?
Szukalski: ArcGIS Explorer 340 was the first release. It shipped with ArcGIS 9.2 in November 2006 but quickly evolved through a number of follow-up releases throughout 2007. A rapid development and release methodology was adopted, enabling a quick response to user needs and the product's evolution.
 Bern Szukalski, product manager for the ArcGIS Explorer team, (left) speaks with an attendee at the 2009 Esri Developer Summit. |
Artz: Has the thinking about where the application fits into the Esri user landscape changed?
Szukalski: We're always learning from users what they want and need. Many other factors also drive change. ArcGIS Explorer sits within a context of evolving Esri products, so the evolution of our other products certainly plays a strong role in where ArcGIS Explorer goes. It's not a stand-alone product or the only product that Esri develops, of course. So it really complements other Esri products and fits into an overall implementation landscape for users.
Artz: Why will ArcGIS Explorer 900 be a major release?
Szukalski: ArcGIS Explorer 900 introduces some very big features. Users will be able to use shared data from ArcGIS, such as layer packages and ArcGIS Online, using state-of-the-art ArcGIS Desktop cartography; they will be able to display their maps in 2D or 3D; and the presentation tools will let users share their geographic knowledge and present information in a geographic context. And the new ribbon user interface also factors in there, since new features are only as powerful as they are accessible to users.
This article was based on an interview with Szukalski that was published on the GIS and Science blog that Artz writes at www.gisandscience.com.
To download ArcGIS Explorer and learn more about what the software offers, visit www.esri.com/arcgisexplorer.