ArcGIS Software and Digital Pens Team Up for Terrorism Drill in Nashua, New Hampshire
By Angelo Marino, GIS Manager, City of Nashua, New Hampshire
When people think about Nashua, New Hampshire, they usually don't think about terrorism. But being 50 miles from Boston and Worcester, Massachusetts—two large urban areas that could be vulnerable to attack—the City of Nashua needs to be prepared to respond to any type of emergency.
On October 24, 2008, the city hosted a drill to test the response to a coordinated terrorist attack. As part of the training exercise, the Nashua Emergency Operations Center (EOC) collected and analyzed data on the fly using both ArcGIS Desktop software from Esri and Capturx for ArcGIS, digital pen-and-paper collaboration software from Adapx, a Seattle-based company. Together, ArcGIS Desktop and Capturx for ArcGIS make information sharing fast and easy.
Like most cities, the City of Nashua relies on GIS systems to help track and coordinate a range of city services, assets, and activities. Data is collected, then centrally stored and analyzed using Esri's ArcGIS Desktop. In the past, teams from city departments collected data on paper maps and forms. That's where the data remained until the paper was sent back to offices and manually retyped into ArcGIS Desktop.
To speed up that process, Nashua adopted Capturx for ArcGIS. The software enables teams to collect information easily on paper maps with digital pens that automatically integrate data back into ArcGIS. Normally, a delay between collecting data and updating ArcGIS is a nuisance but not a life-and-death matter. But during emergencies, every minute counts.
Sharing Information for the Terrorism Drill
The EOC directors decided to use Capturx for ArcGIS to speed information sharing during Nashua's homeland security planning and exercises. Past exercises revealed that the city's data collection processes were inefficient, with important information such as where to place barricades or what areas needed to be evacuated not flowing to all stakeholders.
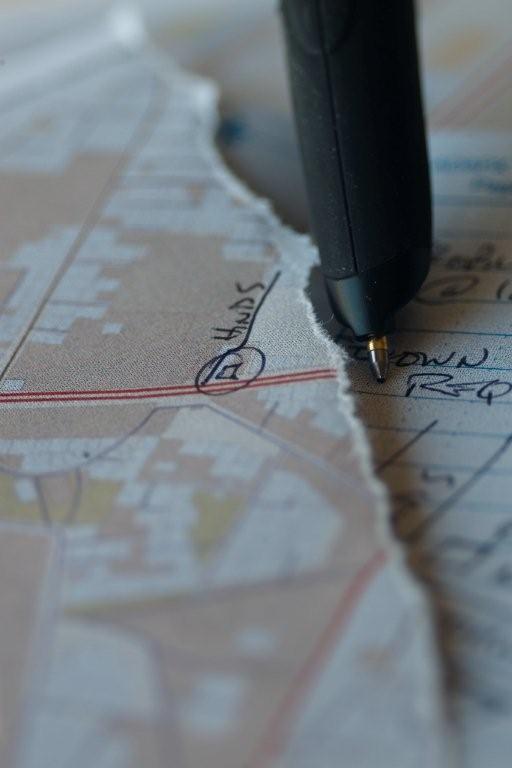 The City of Nashua, New Hampshire, used the Capturx for ArcGIS digital pen to collect data during a training exercise that simulated a terrorist attack. |
The recent training drill included a scenario with simulated explosives, fires, and hostages (played by the city's emergency management consultant's staff). To make the exercise as realistic as possible, the city assembled agencies such as police from Nashua and Hudson, New Hampshire, and Tyngsboro and Lowell, Massachusetts; the fire departments from Nashua and Tyngsboro; and staff from Southern New Hampshire Medical Center, Dartmouth Hitchcock Center, St. Joseph Hospital, Rockingham Ambulance, the American Red Cross, and other state and county organizations.
To accurately portray such an event's unpredictability, planners made sure that information on the ground changed quickly and continuously, using situation injections from the city's consultant and the Nashua Emergency Management Department. The changing information needed to be captured, documented, and disseminated as often and as fast as it happened. During the drill, it was important to let the EOC know where an explosive device was found, where a fire had been set, where the terrorists currently were located, and how the incident was unfolding.
During drills, the information flow from the field to the EOC can prove problematic, in part because of the distance between the site of the incident and the Nashua Police Station, where the EOC is headquartered.
During last October's exercise, the EOC was the central coordination point. But its physical location—two miles from the site of the drill at Pheasant Lane Mall, a large regional shopping mall on the border of Nashua and Tyngsboro—meant that there were challenges to amassing and sharing time-sensitive information. The EOC incident command van, where the Capturx for ArcGIS application was installed, was in a corner of the mall's parking lot along with all the other agency command vans.
In the past, responders at the scene of a simulated incident often would give verbal updates to the EOC staff over the phone or radios. Information such as roadblocks or any field observations would then be documented on maps or forms. To share the update with other departments at the EOC, the entire group would gather around a small flip chart to look at a map of the incident area. An EOC member, using markers, would draw features on the map, such as the location of police vehicles and fire trucks. The verbal relay of visual map information was prone to error, and key stakeholders would often not be present for the ad hoc updates.
For the terrorism drill, the city's GIS department deployed Capturx for ArcGIS to streamline the process of collecting and sharing field intelligence with the EOC.
Using Capturx for ArcGIS, the basic data capture process during the terrorism drill didn't change from previous drills because it continued to use the proven method of collecting field observations with pen and paper. But the process was more efficient because all the data became digital. The GIS department printed maps on ordinary paper using office printers through the Capturx for ArcGIS extension and took them to the field to record important information about the attack. The Adapx extension prints a special watermarked pattern on the map and legend, which is used to determine the location of the features placed on the map using the Adapx pen. Any feature class item that is included in the legend can be used to create new features on the paper map. The process involves touching the feature icon in the map's legend with the Adapx pen, then making a point, line, or polygon on the paper map in the proper location. The pen reads the type and location of the "electronic ink" through an infrared sensor located at the tip of the pen and remembers it all until the pen is docked in the USB-connected docking station.
As team members wrote notes on the maps—information such as where the terrorists were holding the hostages—the Capturx digital pen recorded the ink strokes. Teams simply annotated the maps or used the legend to create new map features. For example, teams could select roadblocks or checkpoints from a legend and draw them on their paper maps. Once the pen was docked into its USB port on a PC or laptop, the field data automatically appeared in ArcGIS Desktop. Notes appeared as handwritten annotations on maps. New features, such as roadblocks or checkpoints, were automatically added to the geodatabase. By using Capturx, the team collected the data quickly, sent it wirelessly to the EOC, and had it displayed to every agency in near real time.
As a result, the entire Nashua emergency response team obtained immediate access to the right information in ArcGIS, in the right formats and contexts. The team members saw the information just as the person in the field collected it. There was no guessing or miscommunication. They were also able to see it within ArcGIS, so teams could immediately manipulate it and create different views and simulations.
One such simulation was using geoprocessing in ArcGIS Desktop to extract all the addresses that fell within an evacuation polygon drawn on paper and converted to a feature class. The list of addresses was printed so that police or fire teams could canvass the area to make sure everyone was evacuated. In the future, EOC administrators hope to employ reverse 911 services so citizens can be quickly notified about an evacuation using the same geoprocessing techniques.
Once the data is collected in ArcGIS, teams can also easily create PDFs to share with other stakeholders, for example. They can send the maps to the police or fire departments or the FBI immediately, without having to worry about how to send a flip chart paper map that has been marked up with a highlighter.
Hopefully, Nashua will never have to respond to a homeland security emergency within its borders or neighboring urban centers. But if it does, the city will be prepared with important tools such as ArcGIS and Capturx.