Editor's note: A trek up Mount Whitney in California turned tragic last year when hiker Kenneth "Wade" Brunette of Hansville, Washington, went missing. Unfortunately, the search and rescue (SAR) teams did not find Brunette alive, recovering his body at the base of a steep slope after a four-day search.
GIS was used during the SAR mission, in part to help plan where to send the search teams. The National Park Service's GIS team came away with valuable lessons on how GIS can assist in searches in the future.
GIS Joins Search for a Missing Hiker on California's Mount Whitney
A map is not the territory it represents, but if correct, it has a similar structure to the territory, which accounts for its usefulness. —Philosopher and Scientist Alfred Korzybski, 1931
By George Durkee, National Park Service Ranger, Sequoia and Kings Canyon National Parks
 Kenneth "Wade" Brunette went missing on Mount Whitney on October 25, 2009. The National Park Service and Inyo County Sheriff's Department began planning a search and rescue operation the next day. |
Darkness and cold were fast approaching when Kenneth "Wade" Brunette, 73, passed two other hikers on his climb up Mount Whitney in California. The hikers were rushing down the trail. It was 3:00 p.m. on Sunday, October 25, 2009.
At 14,505 feet, Mount Whitney is the highest mountain in the lower 48 states. As a day hike, it's a grueling 22-mile round trip—a 6,000 vertical foot climb from the trailhead at Whitney Portal near the community of Lone Pine. Brunette had started his hike at 3:00 a.m. that day, but when the other hikers saw him, he still had two more miles to go to reach the summit. The hikers strongly urged him to turn around, but Brunette, a fairly experienced hiker, insisted he could reach the summit and trek 11 miles back down to his car that day.
The next morning, Brunette's car was still in the Whitney Portal parking lot. No hikers coming down the trail that day reported seeing him. By early afternoon Monday, October 26, the National Park Service (NPS) and the Inyo County Sheriff's Department began to plan and gather resources for a SAR mission.
An important first step in any search is to define the search area: Where was the missing hiker last seen? How far might he or she have traveled since that time? How can that area be divided into sections that can be effectively searched by ground teams and helicopters? The answers determine how many searchers are needed and exactly where to send them. GIS plays a critical role in getting some of these answers. For many agencies, Esri's ArcGIS Desktop is becoming a vital tool in every aspect of a SAR. The software is used to create maps to both visualize and analyze terrain so that planners and field teams can keep track of a constant stream of information including
- Point last seen (PLS), where the person was actually seen, or last known point (LKP), derived from a clue such as the person's backpack
- Perimeter of the entire search area and the individual segments where each team is assigned.
- Clues discovered such as footprints, a backpack, or sunglasses
- GPS tracklogs of helicopter and ground teams
Prior to working with GIS technology, searchers used acetate overlays on top of United States Geological Survey (USGS) maps to record such dynamic information. Now all that data can be recorded, added as needed, then archived for future use.
GIS Assists in the Search
The first ground teams from Inyo SAR began heading up Mount Whitney on Tuesday, October 27. In what was a portent of this SAR's tragic outcome, these teams were stopped by high winds and snow. These same extreme conditions made it impossible to get a helicopter into the area. There was the hope, though, that Brunette might have descended Mount Whitney's west slope into Sequoia National Park and taken refuge among the trees or at a remote ranger station.
 The GIS team created this briefing map that shows where hikers last spotted Brunette on the trail and the areas where search teams were assigned. |
Late that morning, I was brought in as the GIS specialist on the Incident Command (IC) staff for Sequoia and Kings Canyon National Parks, which helped launch the SAR. NPS was searching the west side of Mount Whitney and the miles of trails that led back to where Brunette started from. The Inyo County Sheriff Department's SAR teams were searching the east side of the mountain. This was a huge operation that took searchers into some of the most rugged and remote U.S. terrain outside of Alaska. A large search operation is always intense, seemingly chaotic, and slow to get under way. It's important to get teams into the search area as quickly as possible. But you also need to know where to search. You need to make sure teams are briefed and know where to go, have the right equipment and enough food and shelter. You also need a way of getting them there, knowing who is where, and coordinating with other agencies involved. Finally, it's vital that at every stage of the operation, the search teams can arrive, carry out their assignments, and be picked up safely. For planning all this, we used ArcGIS Desktop to create feature classes for every aspect of the SAR and create dynamic maps to represent the search effort.
I worked with Sequoia National Park's GIS cartographer Sandy Graban and GIS coordinator Pat Lineback. Our first task was to create a map of the potential search area. In conjunction with the park's Plans staff, we first estimated how far Brunette might have hiked since he was seen on October 25. This became a polygon representing the search boundary for our first operational period. A hydrology layer for the park from the park's existing database had polygons for all the watersheds in the Sequoia and Kings Canyon parks. These ridgelines were logical terrain boundaries between valleys and perfect for dividing the search area into manageable sizes for individual teams to search. We used ArcGIS to quickly clip these polygons and use them as the basis for our search segments. Each of the resulting polygons was further divided into areas that could reasonably be covered by one or two teams in a day. Existing NPS trail and stream layers were also added to our map and used as natural boundaries for these segments. We also created a buffer 100 feet on each side of the trail, making a line segment a polygon. Each trail then became a separate search segment for teams to rapidly walk in hopes of finding Brunette. From all this, we created polygon feature classes in a geodatabase that represented the search segments for all team assignments.
Once the segments for the first day's search were established, teams were assigned to each one. Then each team number was entered in the feature class's attribute table within the geodatabase, allowing a Team Assigned label to be created for each segment on the map. Our search area, a daunting 100 square miles, was based on the distance Brunette might have walked in Sequoia National Park since he was last seen on the Whitney ridge. The Inyo SAR teams had another 55 square miles of potential areas to search.
We were also on a steep learning curve. GIS had not been used this extensively in Sequoia and Kings Canyon National Parks on previous SARs. In fact, its use in NPS is not yet common. Through trial and error, we began to make several types of maps designed for different uses. We produced large 42- by 36-inch maps to brief both the IC staff and field teams before the latter were sent into the Whitney area. We generated tabloid-sized maps for field teams to carry with them. On those maps, we could not only add the standard USGS quad but also place the location of helicopter landing zones (LZ) to show where the search teams would be picked up, the boundaries of each team's search area, a grid for easier reporting of locations of clues found during the search (if the team member didn't have a GPS), and the clues we had compiled to date.
Our Incident Command Post (ICP) was 30 air miles from the primary search area, at Ash Mountain, the Park's headquarters. Many people on the IC staff had never been in the area that was being searched. Using Esri's ArcGlobe software, we found that both field teams and IC staff were helped by tabloid-sized 3D maps of the area. A quick glance at the impossibly steep and rugged terrain helped the IC staff visualize how difficult searching some segments was going to be and plan accordingly. Seeing the terrain on these 3D maps allowed briefers to graphically emphasize the need for safety to the teams going out. The SAR's Plans staff also specifically requested tabletop-sized maps they could use as working maps and on which they would draw various search strategies. So the GIS section produced a 24- by 18-inch map that showed the search segments, team locations, and clues. As the Plans staff hand drew assignments and new search segments on the map, GIS would then convert the drawings to feature classes and add them to the next day's briefing maps.
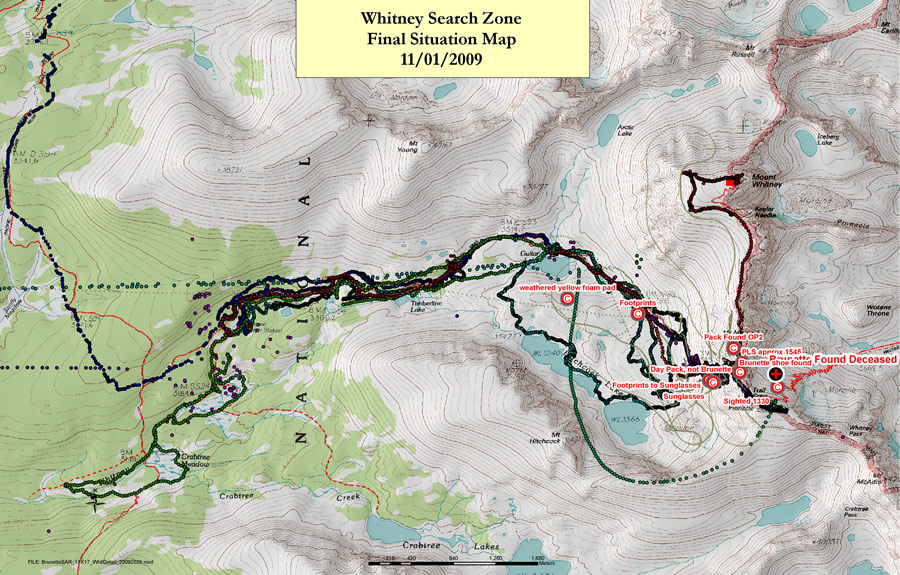 This map shows the GPS tracklogs recorded during the search for Brunette, depicting the areas covered by the searchers. The map also shows clues that were found such as a pack and a shoe and where his body was eventually located. |
We also gathered all the GPS units we could find in the park and issued those to each search team. Tracking the exact route a team takes can become important in deciding where to search in the following days. Before GPS was used in SAR missions, searchers would be debriefed, describe the route they took, then draw it on a map from memory. Downloading the SAR team's exact route from its GPS tracklog and adding it to the map gives the IC staff a much more exact image of the search pattern. It prevents search teams that come in later from working the same route. Holes in the search pattern will be revealed by the exactness of a GPS tracklog-something that was not possible before adapting GIS technology.
Weather Frustrates Search
While we prepared the teams to go out and look for Brunette, the weather was still blocking all attempts to get to the search area. On October 27, the park's helicopter was turned back by high winds. It was not until late Wednesday morning, October 28-almost three days after Wade was last seen at 13,000 feet on the Whitney trail-that the first two NPS teams were flown to the 11,500-foot level on the west slope. Those experienced mountaineers were met with continuing high winds and Arctic-like conditions. Unable to get up on the summit ridge, they were at least able to search some areas at the base of Mount Whitney. They also reported seeing footprints in the snow that seemed recent. The Inyo SAR teams on the east side were having no better luck and were pinned down several miles below the summit ridge.
By Thursday morning, October 28, more than 50 new searchers and dog teams had arrived at ICP at park headquarters and assembled for a briefing. The weather was finally cooperating, and we had two helicopters to ferry the additional teams.
We used the poster-sized maps to brief everyone at once. After the group briefing, each team received an individual briefing on its particular search area along with a custom-made tabloid-sized map for its segment of the search area. Each team received a GPS unit and was given the proper datum and default settings we wanted the coordinates to be recorded and reported in.
When the teams reached their assigned areas, the GIS group began to receive a stream of clues being called in via two-way radio. Searchers found a critical clue about noon on Thursday, October 29: Brunette's pack was found off the trail and only about a quarter of a mile from where he had last been seen. While finding a sign of where he had been was a good thing, the pack still contained all his equipment in it and all the searchers knew how difficult it would be to survive in the horrendous weather of the last three days without his gear. Nonetheless, they hoped he had left the treeless slopes and found shelter in the lower elevations before the worst of the weather hit.
As more teams were flown to the search area, more clues were radioed in by field teams. It's incredibly easy for items such as a discarded candy wrapper, sunglasses, or a foam sleeping pad to be missed and not be acted on as they get lost in the pile of information being called in from SAR teams. Adding all clues with easily identifiable symbols onto a map gives the planners a critical visual aid. Not only can they keep track of each clue but they can also see if patterns are emerging from clusters of clues.
 Photos of Brunette's pack and of the search teams on Mount Whitney were embedded into this map. |
Late in the day, some of the teams' GPS units were flown out, and we could get a more accurate picture of how effectively some critical segments were being searched. This would tell us whether teams should continue in the same area or could be moved to a new one.
The weather improved on Friday, October 30. Our GIS section continued producing maps for IC staff and teams as well as entering all clues, assignments, and tracklogs into a continuously updated geodatabase.
But early that afternoon, word came that Inyo SAR teams had found Brunette's body at the base of a steep slope. We'll never know exactly what happened, but it appeared he fell quite a distance down that slope. In spite of the huge sense of loss all the teams felt, we now had to move quickly to get more than 50 people, dogs, and gear out of the search area. This was made a little easier by having helicopter landing zones shown on everyone's map and giving the coordinates to the pilots. Teams started moving toward those LZs for pickup, and by last light on October 30, we had everyone out and safe. Even though we knew what had happened and where, we still debriefed each team and downloaded the GPS units for later analysis and lessons learned.
Although it had a tragic outcome, the search for Brunette showed us what we need in the future to improve workflow efficiency and better integrate, visualize and analyze data.
First, a method is needed to get near real-time data of GPS tracklogs back to ICP. The ICP was 35 air miles away from the primary search area. SAR teams were staying overnight in the field, and there was no easy way to get GPS tracklogs and other data to us in the GIS section. A great improvement would be to get the teams' GPS data either live or sent to us several times a day. We are experimenting with various methods of doing this, but the rugged terrain blocks all direct radio signals, and even satellite phones have marginal capabilities in much of the mountainous Sierra Nevada.
Second, we need to quickly determine the perimeter of the search area. That's done by estimating how far a person can travel from the PLS. That distance defines the extent of the search area and is where teams are sent to try to intercept the missing hiker from leaving that perimeter and ensure that the size of that area is limited. Esri has generously provided technical expertise to design a Cost Surface Model for ArcGIS Desktop, which will allow us to do that. Using variables of slope, trail corridors, stream crossings, and vegetation density, the hope is that we can more accurately derive the search area from actual terrain and even predict areas where a traveler might be blocked by certain terrain features, such as a high river or cliff, and forced in certain directions. We're also excited about the potential of ArcGIS 10, which will give us the ability to easily upload maps onto a Web server, allowing IC staff to have continuously updated information at their workstations rather than waiting for printed paper maps.
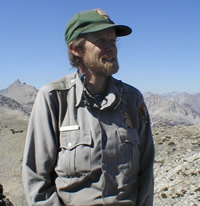 George Durkee served as the GIS specialist for the Brunette SAR mission. |
Since Inyo SAR's IC staff was headquartered 50 air miles away from us, it was difficult to keep updated on each other's progress. We believe Esri's ArcGIS Online will allow a rapid exchange of data and better coordination.
The ability to represent terrain in different ways is a huge advantage of using ArcGIS. For instance, steep slopes can be highlighted in red and automatically segmented to indicate hazards and the need to bring in technical climbing teams. Yosemite Search and Rescue does this, but this simple geoprocessing technique is not widely used.
These and other applications are on our to-do list as SAR experts adapt to new geospatial technologies.
When applied to GIS, Korzybski's comment, "the map is not the territory," is a warning not to make maps or computer analysis a substitute for local knowledge. For all this technology's potential, the lost and injured are found and rescued by dedicated searchers working in difficult and dangerous conditions, who are, themselves, far from help. SAR will always require people with specific knowledge of an area to be able to properly evaluate and make decisions based on that experience. And it's often our hunches and guesses that allow true understanding of a situation that leads to solutions. GIS, though, can be a vital tool to efficiently and effectively envision complex information-turning a flat piece of paper into a better representation of the territory.
For more information on using GIS techniques in SAR, or if your expertise in GIS might help us, contact George Durkee at gedurkee@sonic.net. Members of the SAR community from several government agencies have started a Google group called Using GIS in SAR for Emergency Responders at http://groups.google.com/group/sar-and-gis, where we share techniques and ideas. Full access is for SAR and GIS group members only, but we welcome all who have an interest to simply follow the Sign in and apply for membership link for approval.