ArcWatch: Your e-Magazine for GIS News, Views, and Insights
April 2011
Free Online Mapping Tools Bring Your Maps to Life
Add map notes and symbols directly to your web map.
The latest version of ArcGIS Online includes many additions and improvements that make it easy to design great-looking web maps to share with others, embed in your web page or blog, or use in your web applications.
You can now add pop-up windows, create editable layers, and use time-enabled web maps using the ArcGIS map viewer or ArcGIS Explorer Online, both accessible via arcgis.com. You can then share and use these maps in other ArcGIS clients such as ArcGIS Desktop and ArcGIS apps for smartphones. Esri offers both the ArcGIS map viewer and ArcGIS Explorer Online for free. There's no need to install any software.
New Support for Pop-Up Windows
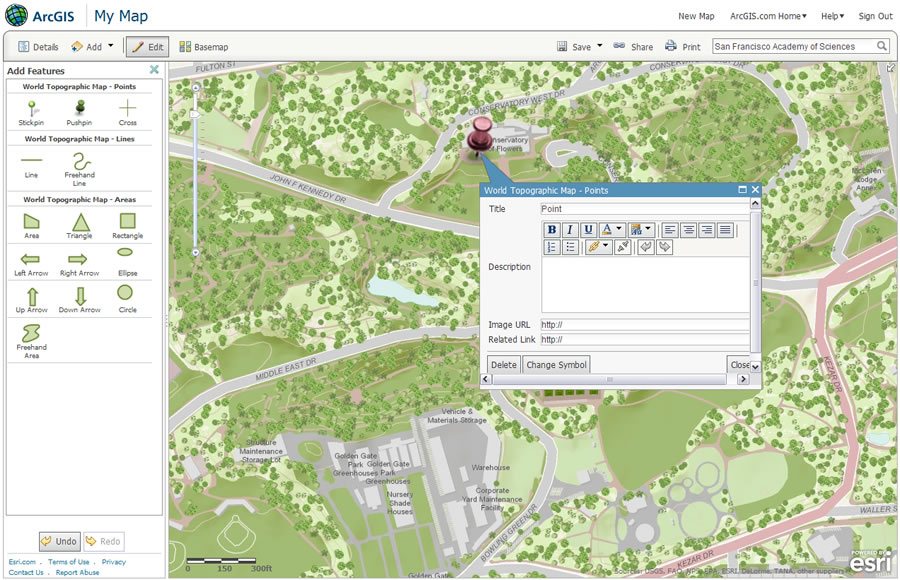
Pop-up windows are great for conveying pertinent and detailed information about specific features in your web map. Information for pop-ups can come from either an editable layer that you create directly in the map or an existing service layer that someone else published and you want to add to the map. For example, if you are creating a hiking trails map and you want to provide details, you can add a pop-window for each trail that displays a title, brief description, photo or image, and a URL to a related website.
You can also display different types of charts in the pop-up window. That's useful when you want to compare information or show statistics for a particular population or location such as consumer spending behavior in different market areas. When you are working with service layers that someone else created and published, your feature-specific information is derived from the attribute set available in the map or feature service. You can still configure pop-up windows, but any text or formatting will apply to all pop-up windows. If you are working with a map service that you own, you can save your pop-up window configurations as a layer property so the pop-up windows are automatically enabled on other web maps that include your service. To learn how you can quickly enable and configure pop-up windows in your ArcGIS viewer maps, watch this short video or read Configuring pop-up windows. For ArcGIS Explorer Online, read the About configuring pop-up windows help topic.
Ability to Edit Layers
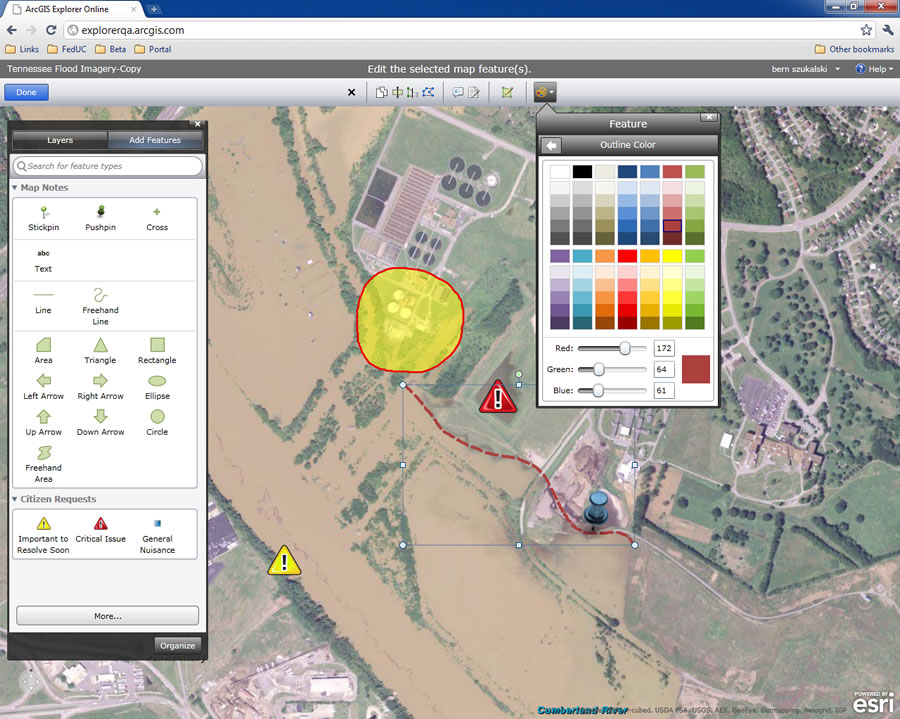
Easily edit features in ArcGIS Explorer Online with intuitive tools.
There are two ways that you can now add an editable layer to your ArcGIS web map: add an existing feature service layer from ArcGIS Server or create an editable layer directly in the ArcGIS map viewer or ArcGIS Explorer Online.
Features from a feature service layer can be edited by anyone who has access to your map. This works well for crowdsourcing maps and applications where you want feedback from many people and you want everyone to see all the edits. Public-facing 311-web applications are a good example. Citizens can report potholes, graffiti, property damage, and other problems in their community. Images or photos that are uploaded are displayed in a pop-up window along with any additional information. If you don't have ArcGIS Server to create a feature service layer and just want to display more detailed information about certain features on your map, you can do that easily by creating an editable layer directly in the ArcGIS map viewer or ArcGIS Explorer Online.
You can choose from six symbol templates organized by category. For example, Map Notes includes pushpins, arrows, and lines; Park Planning includes symbols for picnic areas, bicycle trails, and points of interest; and Oil & Gas Infrastructure includes symbols for oil refineries, treatment facilities, and types of pipelines. Once you select the symbol template you want to use, simply add symbols to your map by clicking the location where you want them to appear. You can then add descriptive information in a map note pop-up window and customize the symbols by choosing a different color palette or adding your own custom symbols by referencing a URL.
If you need to add or remove features, it's as easy as going back to your web map and clicking the Edit button. Adding your own features to a map is a great way to display custom information you want to share with your audience. By default, web maps created with the ArcGIS map viewer or ArcGIS Explorer are not shared. If you share your map publicly, you can embed it in your web page or blog, e-mail the map URL to your friends, or share it on Twitter or Facebook. If you shared your map in ArcGIS Online publicly or with specific groups, others can find and copy it for their own map, augment it with additional layers and create a mashup, then save it as their own map and share their version of the map. This is one of the powerful yet easy ways to collaborate and create content that others will find useful. Watch this short video to get an overview of how to add features to your ArcGIS map viewer map, or read the Creating editable layers help topic for more details. For ArcGIS Explorer Online, read the Create a new feature help topic.
Configuring Time-Enabled Maps
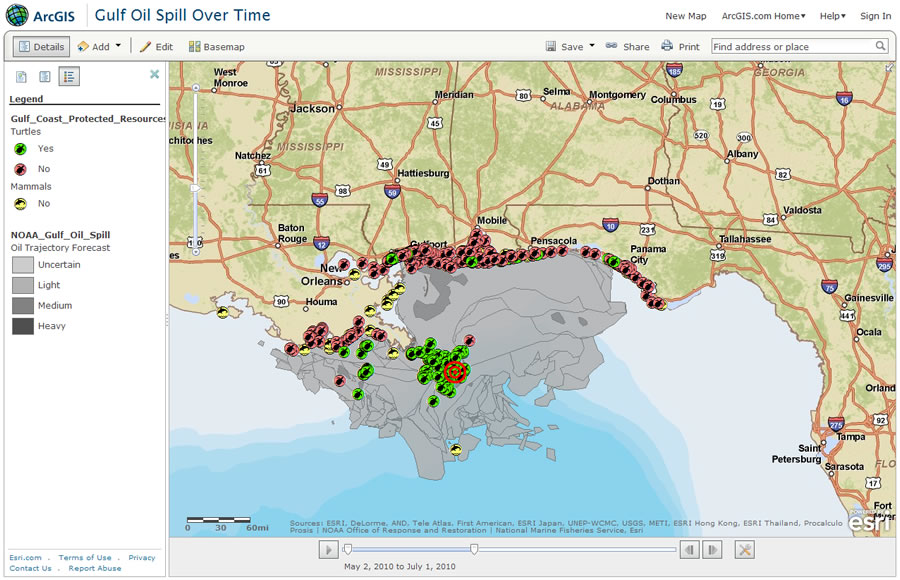
View and configure time-enabled maps that include temporal services.
Support for time-enabled maps became available with ArcGIS Server 10 and now has been added to the ArcGIS map viewer and ArcGIS Explorer. Now, when you create web maps, you can add a published temporal service to your map directly within the viewer. Whether you are creating a time-enabled map or working with one that was created and shared by someone else, you can configure the time slider that appears at the bottom of the map. First, play the time sequence to see how information has changed over time. Then, using the slider controls, configure the playback speed, time span, time window, and slider labels. For example, the time span shows the timeline of each time-enabled layer in your map, so you can compare the timeline of separate layers to each other. You can display time in discrete units of time or cumulatively and only show data that falls within the time window. Time-enabled maps show trends, patterns, and changes in data over time. High demand exists for these types of maps, especially during natural disasters, when they are instrumental to personnel planning and managing the response to crises. The public can also follow news and developments via online maps to get a clear understanding of the impact of a disaster over time, whether it's an oil spill, earthquake, wildfire, or the spread of a communicable disease. Learn more about working with time-enabled maps in the ArcGIS map viewer in the online help or watch this short video. For ArcGIS Explorer Online, read the Display data from a specific time span help topic.
Share Your Presentations Using ArcGIS Explorer Online
You can share professional slide shows more easily than ever using the new version of ArcGIS Explorer Online. Presentations can be shared via direct URL access, making it much simpler to share your presentation with a user who has never used the application before. The easy presentation interface in ArcGIS Explorer Online enables users to make dynamic interactive presentations in minutes. Read the About presentations help topic for more information. For a demonstration of all the new features available in ArcGIS Explorer Online, watch the video.