ArcWatch: Your e-Magazine for GIS News, Views, and Insights
April 2011
Baltimore City Fire Department Maximizes Manpower and Resources with Geospatial Technology

Using computer-aided dispatch (CAD) data, Baltimore City Fire studies response times to determine if the department meets the NFPA 1710 Standard. To be compliant, the agency must have an engine on scene in four minutes and an effective firefighting force on scene in eight minutes.
Baltimore City Fire Department, which serves the city of Baltimore, Maryland, has faced its share of challenges in recent years. Staff reductions, station closures, and spending cuts have hit the agency, a scenario all too familiar to other fire departments across the country. However, technology such as GIS helps Baltimore City Fire meet mission requirements during these tough economic times. The technology helps the department with strategies for increasing response times, better allocating manpower and resources, and planning for large events. The agency uses GIS to capture and manage a wealth of data. Once in a database, it gets sliced, diced, and visualized to solve all sorts of problems. The result is a more effective firefighting force that uses information as a resource to save lives and protect property. Over the last two years, the department implemented a robust ArcGIS platform with a number of successful applications that support complex missions. This effort was led by Jim Potteiger, special assistant to the chief of the fire department, Baltimore City Fire Department, and his colleague, firefighter and paramedic Peter Hanna.
The result? A leading-edge GIS capability that grew out of the work of two firefighters who had no prior GIS software experience, training, or official budget.
Getting Response Times Right
Baltimore City Fire serves a geographic area of 81 square miles and a population of more than 640,000. Led by fire chief James Clack, the agency has more than 1,800 members, who are divided into two management branches—Emergency Operations and Planning and Administration. Every year, the department responds to more than 163,000 emergency 911 calls.
Before using GIS, Baltimore City Fire found that meeting response time standards and guidelines was difficult given the high number of calls the department receives. The agency wanted a more efficient method for measuring and determining whether it was meeting response time standards, such as the National Fire Protection Association (NFPA) guidelines, and, if necessary, what could be done to improve response performance.
Enter geospatial technology. Hanna extracted incident data from the department's computer-aided dispatch (CAD) system and geocoded it. Then he and Potteiger looked at incidents and arrival times to determine exactly which responses failed to meet standards and where improvements were needed. They could then begin to ask the all-important question of why some responses to calls failed to meet response time goals. A GIS analysis showed exactly which apparatus—a fire truck, fire engine, or chief—met or failed the standard for each incident and what the response times were for each vehicle.
The first year for which the data was gathered and analyzed was 2008. The NFPA standards mandate a 90 percent success rate for meeting response call times within the given four- and eight-minute timelines. Baltimore City Fire discovered it had roughly an 85 percent success rate.
The GIS analysis by Hanna and Potteiger led to an important discovery.
"When we closed a company for preventive maintenance, we lost coverage if it was the only one for that area," said Hanna. "We identified the problem based on real information derived from our own analysis."
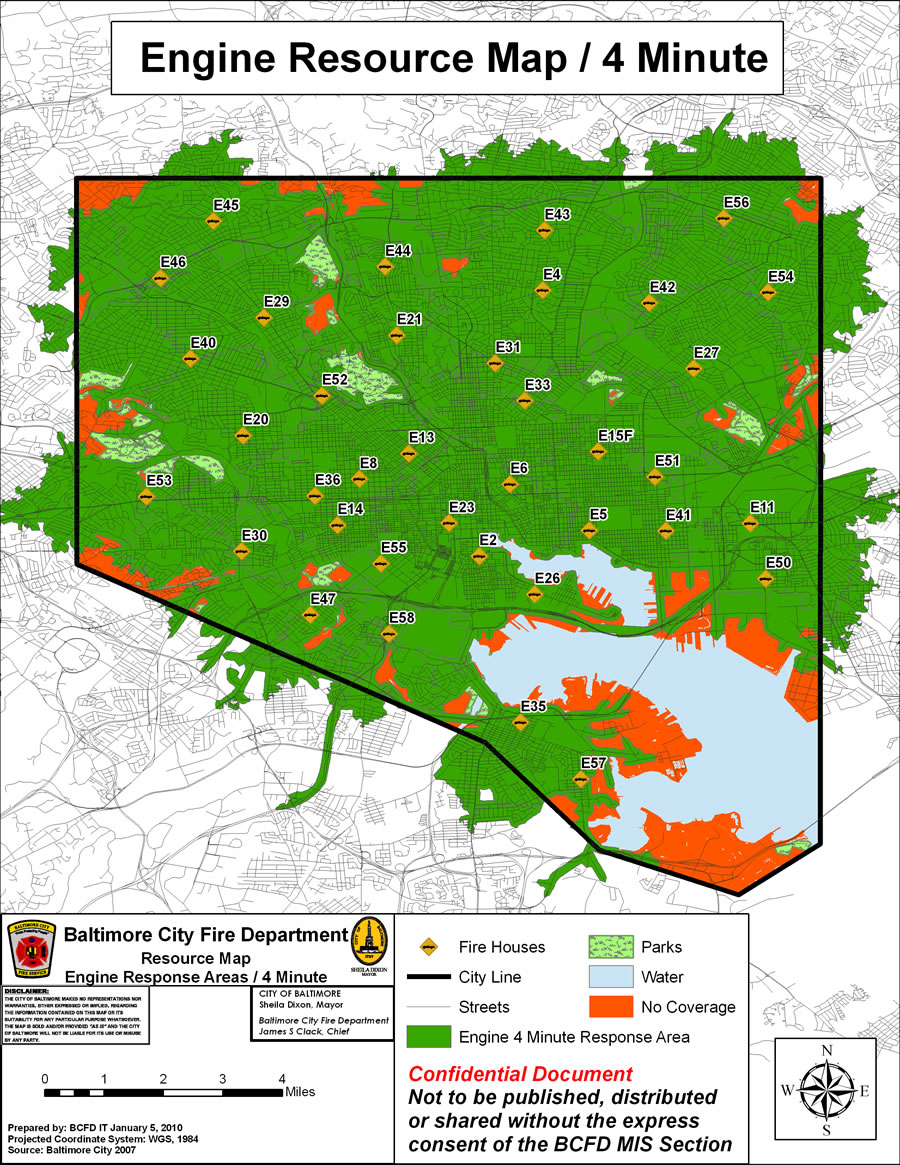
The digital pegboard is a geoenabled PDF that allows fire chiefs to determine coverage based on travel time from a fire station. The ArcGIS Network Analyst extension was used to determine the polygons.
Baltimore City Fire quickly implemented a new policy. If agency officials took the only available company out of service for maintenance or repair, they would move another company unit from a double station (with multiple apparatus) to cover that area. Having mapped all the firehouses, types of vehicles, response times, and areas of coverage, they now had the information visualized to identify when and where a unit was taken out of service. They could also identify which other unit could provide coverage.
Launching the Digital Pegboard
The result of the analysis and vehicle tracking through CAD led to an all-important application: the "digital pegboard." The digital pegboard is a geoenabled PDF used by shift commanders to determine response capabilities. The pegboard shows a map of fire stations and their service districts and coverage areas using color-coded polygons based on a four-minute response time.
Shift commanders use the tool to understand the impacts of closing, or "browning out," a station during any given shift; they can quickly compare volume of service in each area against a potential station closure. In 2010, Baltimore City Fire began doing this type of analysis since the agency and the City of Baltimore were experiencing a budget crisis.
Hanna generated four-minute response polygons for each fire station using the ArcGIS Network Analyst extension to compare against incidents imported from the computer-aided dispatch records database. The polygons were then exported into individual shapefiles. In essence, there was one polygon for each fire station.
Then the shapefiles were put into a geoenabled PDF, where each station's four-minute response coverage area could be easily turned on or off to understand the impact of any closure to response times. The application was perfectly designed for its intended users: fire officers pressed to make life-and-death strategic and tactical decisions. They were busy managing firefighting operations and did not have time to become hands-on software users.
"Everybody knows how to open PDFs," said Hanna. "Fire officers were pleased because they could quickly identify where a problem existed."
Baltimore City Fire Service emblem
The digital pegboard was a success, and agency fire officers quickly adopted it. Due to the achievement of this application and others, Baltimore City Fire was recognized with a 2010 Esri Special Achievement in GIS Award as well as other industry accolades.
Preparing for Large City Events
Baltimore City Fire also uses GIS to assess critical infrastructure, which helps the agency prepare for major city-hosted events or respond to large-scale disasters. Data on streets, buildings, hydrants, and electric lines and aerial images are combined to determine asset vulnerabilities for natural disasters or other threats.
For instance, this year, the City of Baltimore will host a large Grand Prix Indy race for the first time. Preparations for this major event, which thousands will attend, are extensive. The fire department must have staff in place to respond to a major incident or multiple incidents at once.
With a digital map view of data that can be easily manipulated, commanders have a better method for planning ahead. Hanna provides analysis and mapped data to
- Identify critical infrastructure within designated areas.
- Identify areas for relocating units.
- Determine routing for emergency and nonemergency vehicles.
- Conduct preincident planning.
- Map any incidents that occur.
Pilot Project for the Future
Baltimore City Fire created a web application with the ArcGIS API for Flex, deployed on ArcGIS Server, that provides building information to responders quickly and easily. The ArcGIS application being tested provides building information through an easy-to-use map display. "This application will aid first responders to view and become familiar with the location of vacant and unsafe buildings in their districts," said Hanna. "We see many potential benefits. We'll continue to work to provide applications that meet specific mission demands and better serve our community."
For every call, emergency responders need to know as much information as possible about the incident and its location before responding. Building information is often captured and maintained using large databases, but getting that information quickly and easily to fire personnel responding to a call can be a challenge. Paper notebooks with building preplans help responders know what they're walking into, but they can be cumbersome.
Fire staff can quickly access and view the data and pan and zoom to any of the 4,000-plus buildings deemed dangerous by the city's Housing Authority. They can then click a particular building icon to see available information specific to that structure.
"We've done a lot in a short amount of time," Potteiger said. "Chief Clack has been very supportive. Without him, this would never have taken place."