ArcWatch: GIS News, Views, and Insights
April 2012
Do You Live in Canine Country?
Data and Maps from Esri Show Where American Pet Owners Lavish Fido and Fluffy with Treats
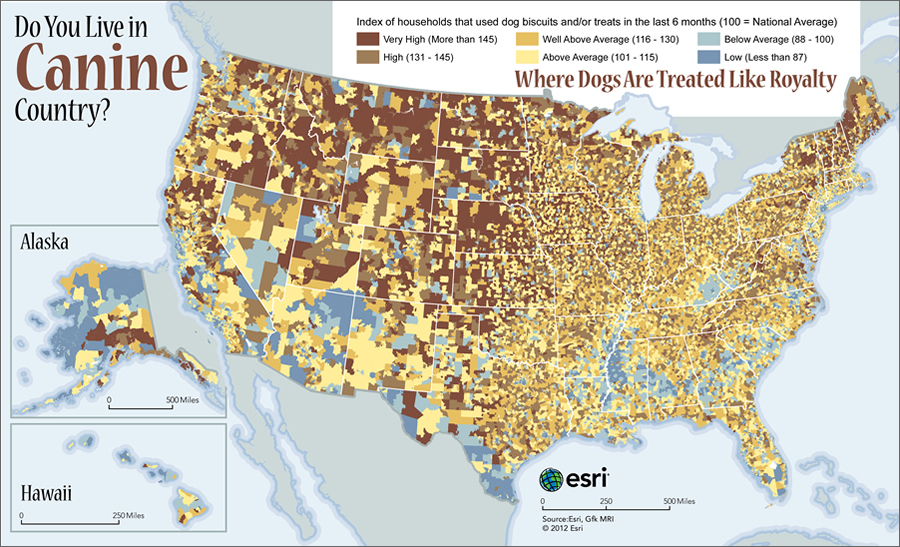
Demand for dog treats is higher than average in states such as North Dakota, South Dakota, Montana, and Idaho.
A rough economy? Danny Harland's dogs Boston and Roxy don't think so. Though he's currently out of work and has a family to feed, Harland's beloved Boston, a Great Dane, and Roxy, a Newfoundland, never get the short end of the stick.
Harland, a licensed plumber, spends at least $20 a month on pet treats like rawhide chews and even feeds them regular meals of raw meat—a more expensive option than dry dog food. "I just want to provide the best for my family," said Harland. "And the dogs are part of our family."
Harland, his wife, three children, and two dogs live in San Bernardino County, California, an area that has been hit hard by unemployment. But even without steady work for three years—despite going through a rigorous apprenticeship and passing a state test—he's loath to deprive his pets of the treats they love.
Harland's not alone. Millions of Americans from Maine to Alaska show the same devotion to their dogs and cats, even as they pinch pennies elsewhere. Where do pets get treated the best across the United States? The interactive maps Do You Live in Canine Country? and Do You Live in Cat Country? tell the story, with the darker brown colors showing the areas where household demand is high for dog and cat treats. Blue shows areas where household demand is low for the treats. If you click a state, county, ZIP Code, or block group, additional information will appear on the map such as how many households used cat and dog treats within a recent six-month period. A pie chart indicates whether it's cat or dog country, comparing the number of cat households to dog households in the area. In most parts of the United States, dog households outnumber cat households.
View Larger Map
Americans Love Their Pets

Miles lives in what the Esri map says is canine country: Yucaipa, California.
More than 62 percent of American households, or 72.9 million homes, own a pet, and many owners enjoy pampering them. Americans will spend a record $52.8 billion on their pets this year, according to the American Pet Products Association (APPA). This is almost $4 billion more than the $48.35 billion they spent in 2010, a time when the American median household income, when adjusted for inflation, actually decreased. However insecure Americans feel about the state of their financial affairs, it does not seem to stop them from spoiling their pets.
Treats are a fast-growing category of spending on pets. Like Harland, many consumers consider their pets members of the family and love to pamper them, spending an average of $70 on dog treats and $41 on cat treats each year, according to the APPA.
To find out what areas of the country exhibit a high, average, or low demand for pet treats, Esri staff analyzed Esri Consumer Spending and Market Potential data to find the number of households in each state, county, ZIP Code, and block group that purchased dog or cat treats during a recent six-month period.
Starting with a map template for interactive demographic web maps, the data was added to ArcMap in ArcGIS for Desktop as a file geodatabase and analyzed to find patterns in the demand. Colors were chosen to emphasize areas of high demand as well as those with low demand. Once each map was reviewed using a web map publishing checklist and approved for publication, it was published as a service from ArcGIS for Desktop directly to an Amazon cloud server running ArcGIS for Server. Then a simple web map was created in ArcGIS Online with pop-up windows highlighting key information about each area such as how many households used dog and cat treats and the numbers of households with dogs compared to the number with cats. Each web map was then configured in ArcGIS Online as an embeddable application and inserted into an HTML page. (To create an interesting thumbnail for maps like this in ArcGIS Online, follow this tip.)
By mapping Esri data, it is easy to see where demand is the highest and lowest for dog and cat treats and where dogs dominate and cats rule.
Where Dogs Are Treated Like Royalty
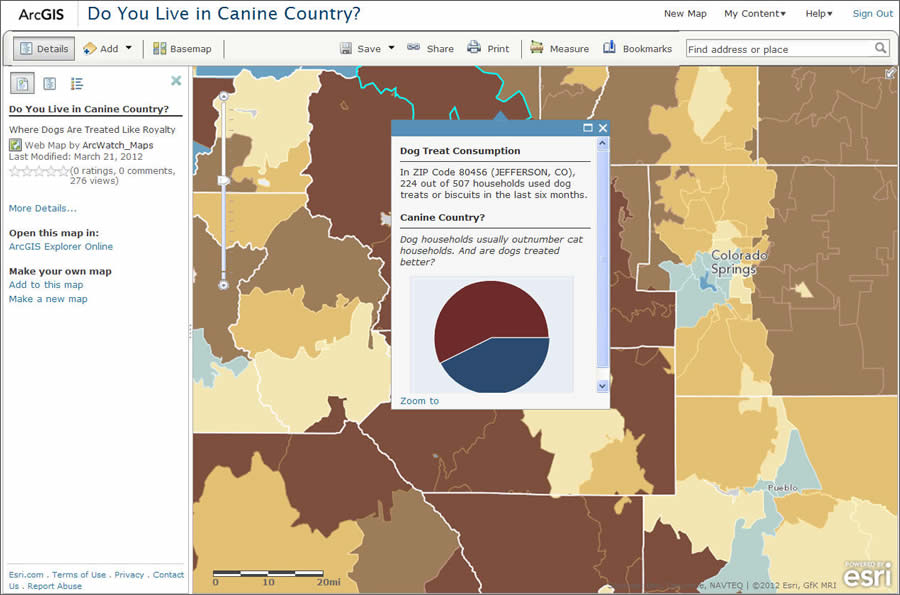
Jefferson, Colorado, is deep in the heart of canine country.
The Do You Live in Canine Country? map shows a swath of beagle brown across the northern section of the Midwest, indicating very high demand for treats. For example, dogs get the royal treatment in Idaho, Montana, Wyoming, Colorado, and North and South Dakota. The state of Texas, home of the fictional dog Old Yeller, has pockets with areas of below-average spending. Other states, including Georgia, Kentucky, and Alabama, have many areas of below-average use of treats.
While the top 10 areas of high demand for dog treats can be found in very different locations (Pagosa Springs, Colorado; Topeka, Kansas; and Saylorsburg, Pennsylvania, for example), they do have factors in common. The residents of these areas are predominantly middle class, attended college, and don't have children.
Dogs generally outnumber cats in American households, particularly in parts of Mississippi, Georgia, and Alabama. There, demand for cat treats is lower than average.
Where Cats Are Treated Like Stars
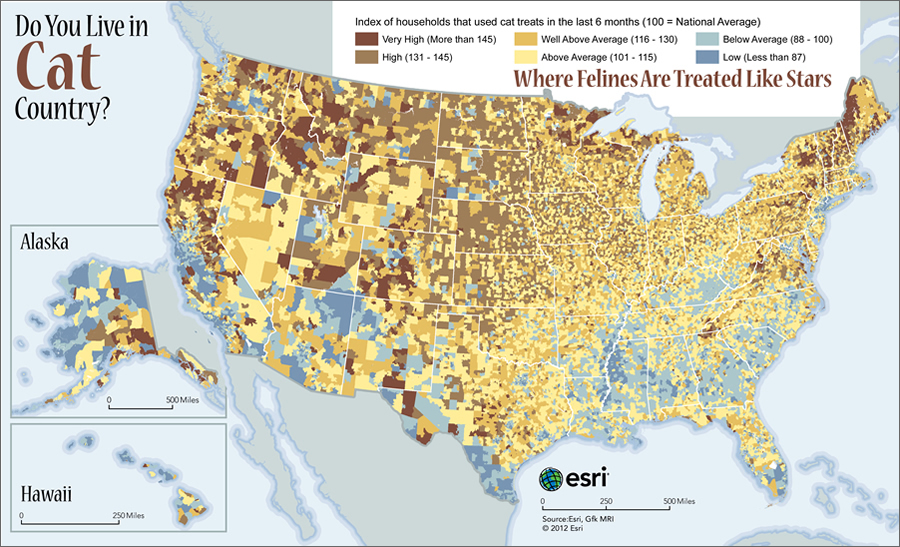
Demand for cat treats is higher than average in Pennsylvania, Maine, northern California, Idaho, and parts of Minnesota.
The Do You Live in Cat Country? map shows cats have their claws in the heart of the Midwest, with above-average demand for cat treats extending in a band that stretches from Oklahoma to North Dakota. Urban centers like Seattle, Washington, San Francisco, California and Chicago, Illinois, have a below average demand for cat treats.
Philadelphia, Pennsylvania, is a feline's fantasy: the city is home to 7 of the top 10 ZIP Codes in the country with the highest demand for cat treats.
While kitties sitting pretty in a high-rise apartment might come to mind, the households with the most demand—91 percent of those living in ZIP Code 19142—are lower middle-class families who use public transportation and didn't receive a high school diploma, the data shows. This information comes from Esri's Tapestry Segmentation data that classifies US residential neighborhoods into 65 unique market segments based on socioeconomic and demographic characteristics.
View Larger Map
Location Matters to Pet Businesses

Stripes lives in New Freedom, Pennsylvania. The state boasts several ZIP Codes where the demand for cat treats is higher than average.
Understanding where the demand is highest for dog and cat treats can feed more than curiosity. Mapping this data helps pet supply businesses tap into undiscovered markets and increase their bottom line.
Southern States Cooperative, a company known mostly for its farm feed and supplies, did exactly this when it looked at expanding into pet supplies and food. "In fact, we use geographic data to determine types of pet supplies to place in certain stores," said Julia Marsh, a business analyst at Southern States Cooperative.
The Richmond, Virginia-based cooperative has provided feed and supplies to customers on the East Coast through a network of company-managed stores and independent dealers for almost a century. When Southern States considered opening a new store in Georgia targeted to consumer goods like cat and dog treats, there was a concern within retail management that the new store might take sales away from another Southern States co-op nearby.
Marsh analyzed sales of the existing store and location of customers and potential customers using Esri's ArcGIS along with Esri's Tapestry Segmentation data. She found out that while the store successfully sold more than $100,000 in bulk agricultural products, less than $25,000 of that was targeted to small animals like cats and dogs.
"We realized by looking at the geography of where our customers were located and segmenting our customers based on their purchases that the prospective location would not have an adverse effect on our existing store," said Marsh.

Besides smelling flowers, cats like Max like to sniff out snacks from pet stores.
Popular pet supply retailer Petco also uses Esri technology and data to understand the market when opening new stores. While Petco has a savvy team making decisions about where to locate outlets, using GIS helps clarify the process.
"Opening new stores is a critical component of Petco's growth strategy," said Shawn Hanna, Petco's director of financial analysis. "We use spatial analysis to help us target the best locations for new Petco and Unleashed by Petco stores around the United States."
Businesses use Esri's GIS and data to find opportunities. They analyze not only what consumers want, but where those consumers are located. It may seem risky in today's depressed retail environment to open new stores, like Petco has done, or branch out to offer new products, like Southern States recently did. However, taking a close look at the data to find pet owners like Danny Harland can pay off, even when conventional signs, like staggering unemployment rates and depressed economies, say they don't exist.