ArcWatch: Your e-Magazine for GIS News, Views, and Insights
May 2011
Chesapeake Bay Restoration Transparent to Public
Esri and Chesapeake Bay Program Build Web-Based Accountability Tool
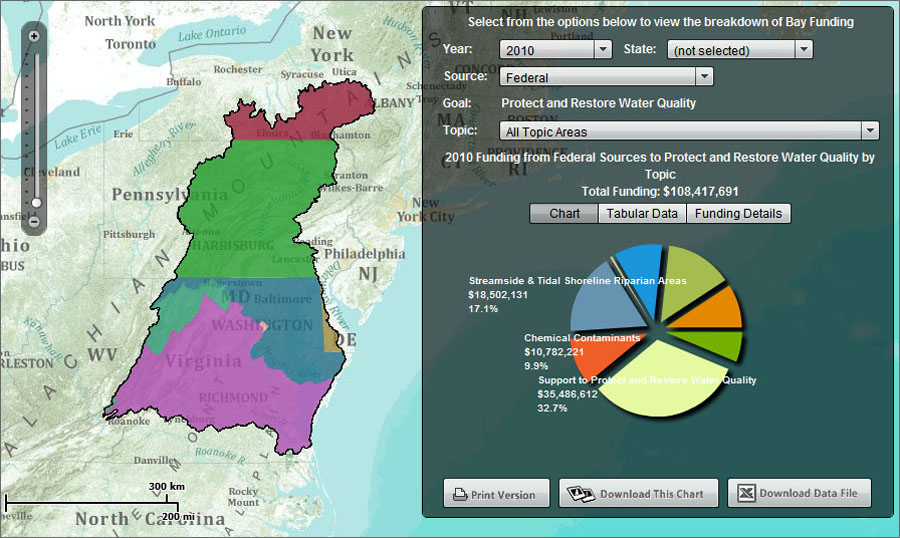
ChesapeakeStat shows the breakdown of federal funding for restoration of riparian areas, remediation of chemically contaminated areas, and the protection and restoration of water quality.
A web mapping application called ChesapeakeStat tracks the progress of the restoration of Chesapeake Bay, long plagued with problems such as pollution. The bay is the largest estuary in the United States, bordered by Maryland and Virginia. Its watershed, however, also includes Delaware; New York; Pennsylvania; Washington, D.C.; and West Virginia.
The Chesapeake Bay Program (CBP), which works to restore and protect the bay’s resources, launched ChesapeakeStat so the public, US Congress, restoration stakeholders, and project managers can follow the progress, status, and funding allocations of the bay’s restoration program.
The CBP team worked with Esri and others to build ChesapeakeStat. “ChesapeakeStat is a geoaccounting tool,” said John Wolf, US Geological Survey (USGS) and geographic information system (GIS) team leader of CBP. “Esri has been instrumental in developing the successful StateStat and BayStat models that were implemented under the leadership of Maryland’s governor Martin O’Malley. It was a natural step to work with Esri staff on the design of our project, which takes [the models] a step further. People can see in a geographic context how an agency’s goals, strategies, and outcomes are being accomplished.”
ChesapeakeStat is built, in part, on Esri’s ArcGIS Server and ArcGIS API for Flex. Visitors can easily zoom to an area on the map and locate restoration activities, then drill down into smaller watershed units to see what is happening in a specific area. The web mapping application is the first one-stop GIS project to improve accountability for all partners in this restoration effort. Eventually, the public will be privy to all bay and watershed restoration activities, funding levels, and progress toward goals.
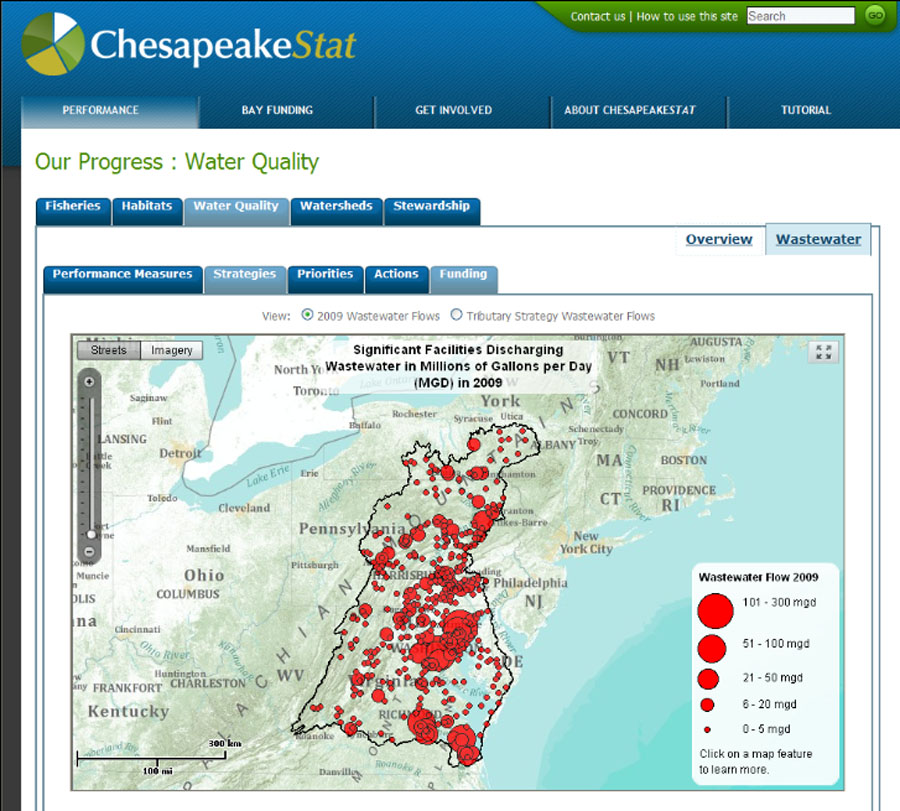
Water GIS applications give ChesapeakeStat users insight into pollutant and remediation activities. A wastewater application built with ArcGIS API for Flex accesses and displays wastewater discharge data.
With a design that is closely related to the CBP Strategic Framework, ChesapeakeStat describes how funds from the federal and state governments and other partners will be used during each fiscal year. It also includes a database of project information. GIS makes this database user-friendly so the public can visualize the information geographically.
ChesapeakeStat organizes information around the CBP’s goals of sustainable fisheries, healthy habitats and watersheds, water quality, and Chesapeake stewardship. Each category contains a suite of environmental and performance indicators.
The ChesapeakeStat tool supports an adaptive management approach, which is CBP’s management strategy to set goals, define strategies, set priorities, take action, and monitor and make management adjustments. This means that, beginning at the overall goal level, users will ultimately be able to drill into detailed scientific data and analyses that support decision making. CBP’s goals and strategies are included in the design of the website dashboards, which interactively present performance and environmental information organized by strategic topics. The database includes management activities for conservation and restoration in the estuary and throughout the watershed.
The ChesapeakeStat application accesses a geodatabase that contains the spatial and tabular information that’s visualized on the website. Content is organized by operational stages of measuring progress, taking action, and developing priorities as to where to target restoration and protection activities.
Progress can be tracked in five major program areas:
- Sustainable Fisheries (crabs, oysters, striped bass, and other fish and seafood)
- Healthy Habitats (fish passages, bay grasses, and wetlands)
- Water Quality (wastewater treatment, agriculture, and storm water)
- Healthy Watersheds (land conservation and protection)
- Chesapeake Stewardship (public access, environmental education, and citizen and community action)
Starting at each of these program areas, users can get down to the level of detail they need to see. CBP business goals are categorized in the application. For example, a resource manager can go to the Water Quality category, select the wastewater topic, and quickly learn about the collective issues and initiatives dealing with that topic.
The Performance Measure tab leads to a tool that allows the user to see how well restoration efforts are meeting the CBP partnership’s goals. A goal may be a stated level in terms of nitrogen or phosphorus pollutant load reductions achieved basin-wide. In many cases, goals are attached to geography. In the future, users will be able to drill into a geographic area on the map to get a more comprehensive understanding of pollution source sectors. They will be able to access one indicator measure for the entire bay area, such as dissolved oxygen, then compare this same indicator among other watersheds. For a single watershed, users can explore different pollution indicators for that particular geographic area.
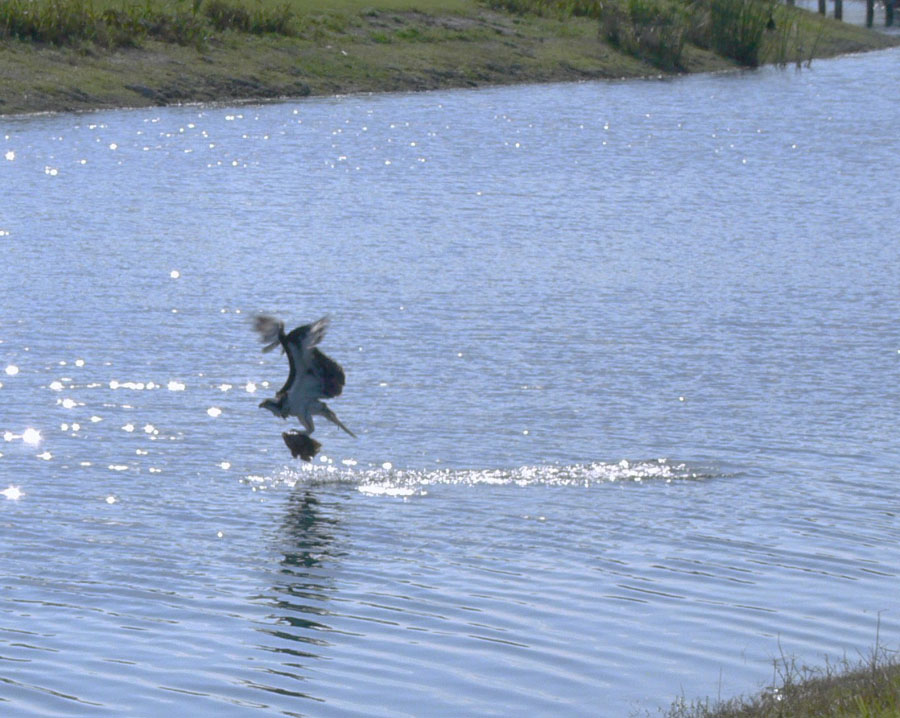
Photos can be shared on the ChesapeakeStat web site such as this one of an osprey on the Chesapeake in Jug Bay, Maryland.
ArcGIS Server supports scale dependency for CheasapeakeStat. As the user explores a selection, the accompanying map interface changes relative to the selected topic. By selecting the Strategies tab, a user can see nitrogen pollution from wastewater sources throughout the bay watershed. Facilities that contribute more nitrogen to nearby receiving waters are shown with a larger symbol, regardless of the map scale selected.
The Priorities tab opens up a map that shows priorities for several programs that focus on reducing pollution.
The Actions tab opens a page showing activities associated with each of the jurisdictions’ progress in reaching short-term interim goals or two-year milestones.
Finally, the Funding tab accesses information about the financial investments the partners are making to control pollution from various sources. The funding information can be sorted by year, state, source, goal, and topic.
ChesapeakeStat accesses other systems for data and information through web services. For instance, CBP uses the Environmental Protection Agency (EPA) Enforcement and Compliance History Online (ECHO) data to tell the wastewater facilities story. In the future, ChesapeakeStat will pull data directly from Maryland’s BayStat as well as other partner data resources. Chesapeake Bay recovery prospects are not hopeless. Regulation, enforcement, best management practice implementation, education, citizen engagement, and a watchful eye can bring the estuary back to the state it was in 50 years ago.
Read more about Esri’s solutions for environmental management.