ArcWatch: Your e-Magazine for GIS News, Views, and Insights
May 2011
Thinking Spatially about Crowdsourcing
If Web 2.0 is the web plus interactivity and conversation, then you can think of Disaster Response 2.0 as increased interactivity and conversation between responders, affected populations, concerned communities, governmental agencies, and nongovernmental organizations (NGOs).
Crowdsourcing and social networks breed conversation and interaction. These conversations help to get information about what is happening in areas affected by the disaster into the hands of crisis teams before official responders arrive on the scene. Tapping into community conversations during a crisis provides additional information sources to support better decision making.
Esri’s work on disaster response mapping projects during the last several months revealed some important things about crowdsourcing’s usefulness.
Social Networks + Location Can Connect You with Your Neighbor
Providing this inherently spatial information in a spatial context can connect individuals and optimize the use of trained resources.
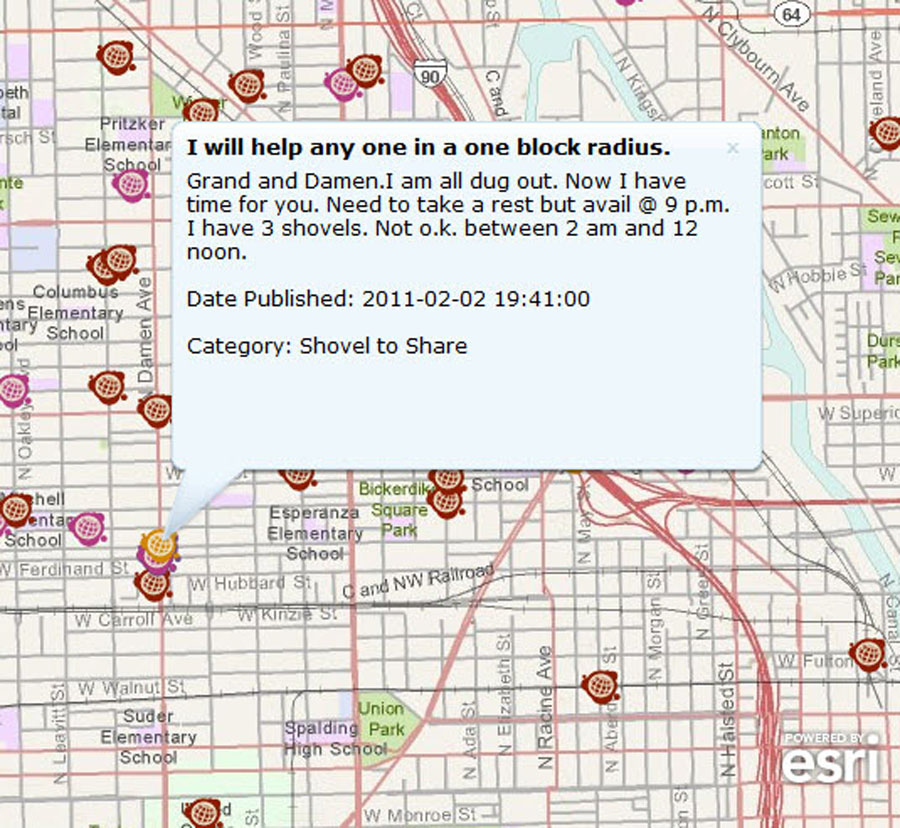
Location-aware social networks have a huge potential for enabling people in a community to help themselves during a crisis. Consider the example of a major snowstorm in Chicago, Illinois, earlier this year. Ushahidi, a nonprofit technical company, set up a platform that allowed Chicago residents to post both needs (for instance, ”My driveway is inaccessible. I need a snow shovel”) as well as solutions (“I have an extra shovel to share and will help anyone within a one block radius”).
Providing this inherently spatial information in a spatial context can connect individuals and optimize the use of trained resources.
Accurate Locations Lead to Good Decisions—Poor Location Accuracy Does Not
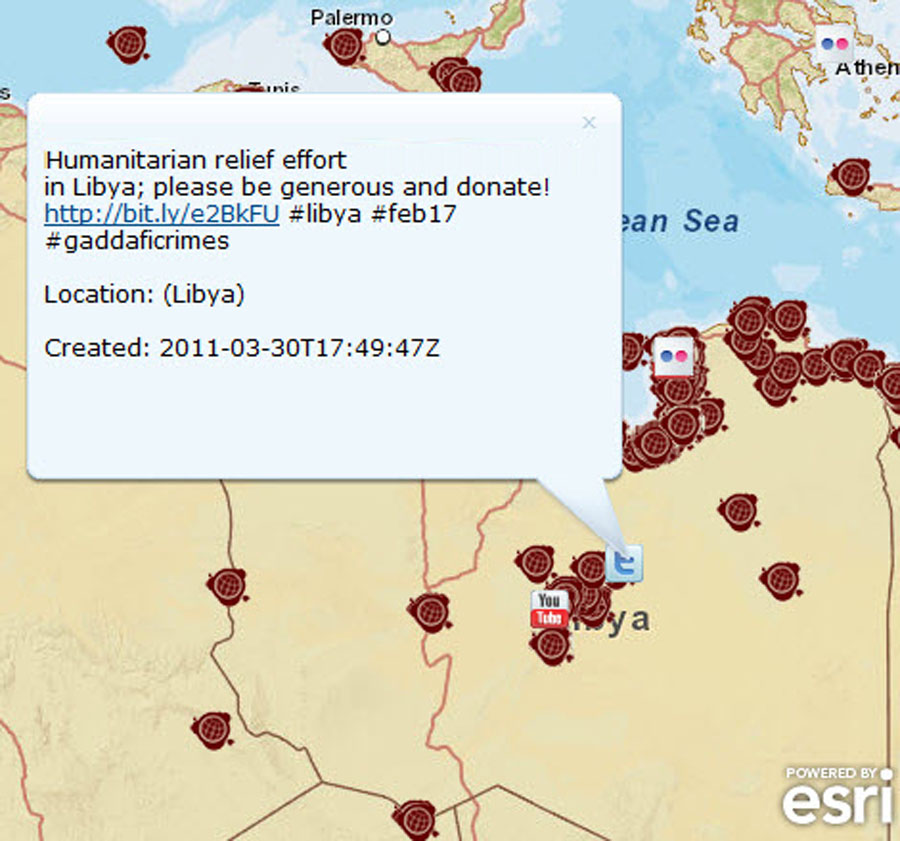
This map displays content about the crisis in Libya that's coming from social media and other sources including Twitter, YouTube, and Ushahidi.
While it’s difficult to ascertain the spatial accuracy of content from social networks, taking into consideration the type of social network you are working with helps a great deal in understanding the quality of spatial information contributed. Take Twitter for example: people Tweeting are not necessarily thinking about location and probably don't even realize that their Tweets could be used to gain insight into disaster response efforts. Compare this to someone purposefully posting to a managed crisis response network that contributes volunteered information to the response effort. A network that produces actionable information is more likely to solicit actionable content.
Spatial Analysis Is Key
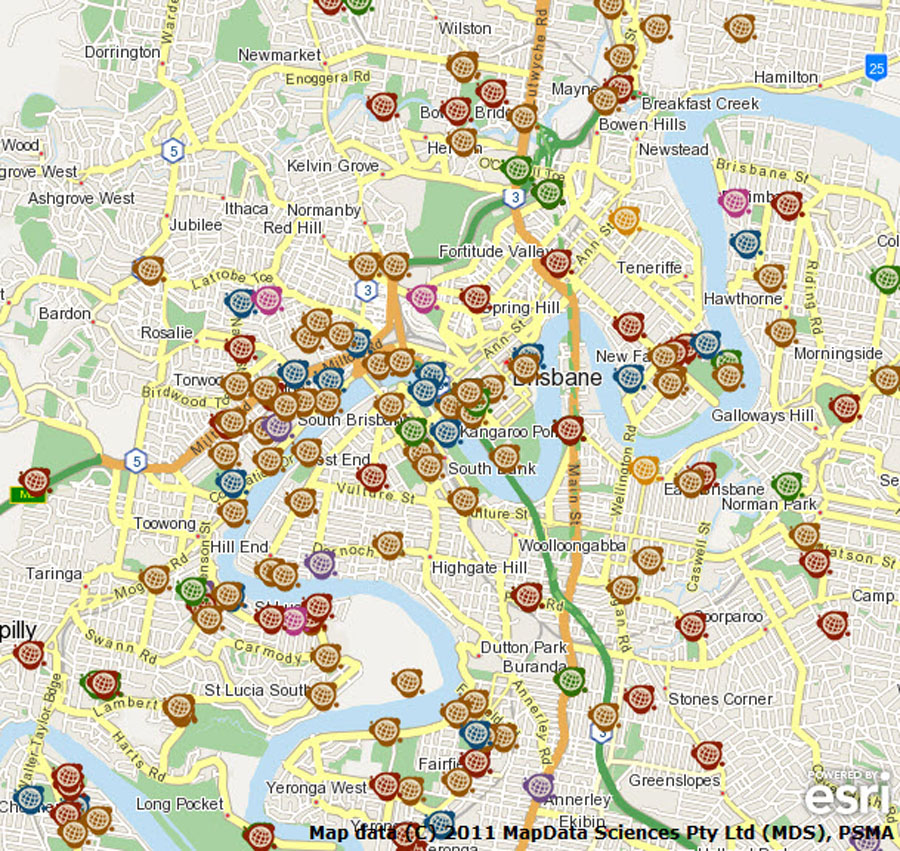
Each of these points represents an incident report from someone affected by the flooding that occurred in Brisbane, Australia, in January 2011. The incidents have been color coded according to specific needs but it is still very difficult to decide which areas require the most assistance.
Performing spatial analysis allows you to transform data into intelligence by uncovering trends and correlations that are not visible in the raw data.
Each of these points represents an incident report from someone affected by the flooding that occurred in Brisbane, Australia, in January 2011. The incidents have been color coded according to specific needs but it is still very difficult to decide which areas require the most assistance.
With an enormous number of reports, how can we make sense of the situation?
This image shows just road closure data from the incidents in the previous image represented as hot spots. Based on reports from the community, the location of impassible roads can be quickly determined.
Visualizing reports as hot spots, or trends, gives us an idea of density. The map above, which shows hot spots of road closures, helps responders and citizens make decisions about where to travel. Hot spots also indicate several similar reports in an area, helping to validate individual incidents and thereby providing increased situational clarity.
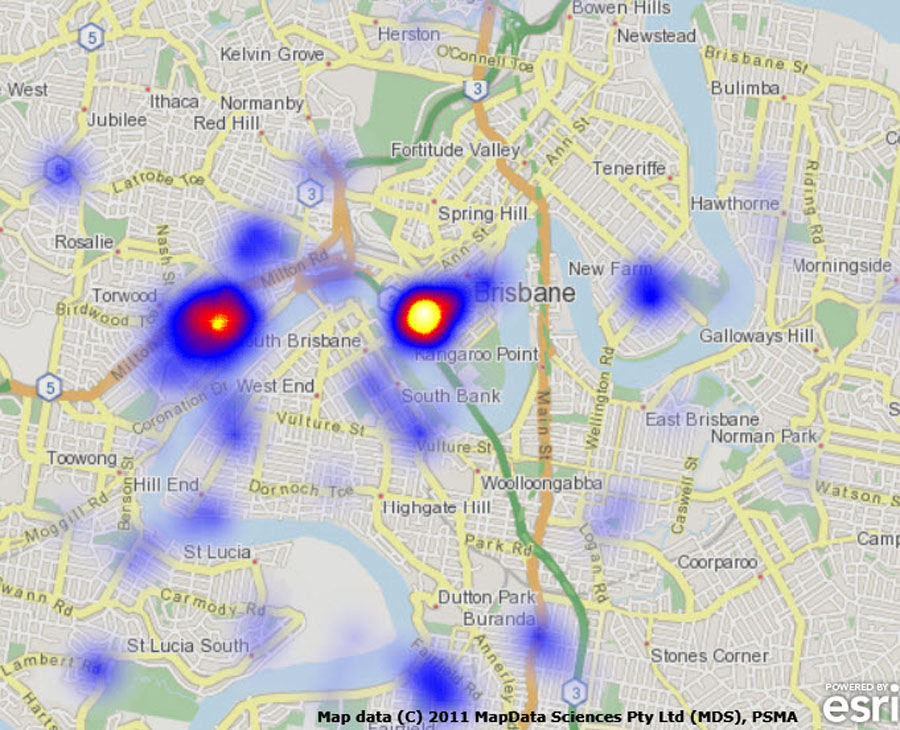
This image shows just road closure data from the incidents in the previous image represented as hot spots. Based on reports from the community, the location of impassible roads can be quickly determined.
Performing spatial analysis allows you to transform data into intelligence by uncovering trends and correlations that are not visible in the raw data.
Going forward, many great opportunities exist for GIS analysts, cartographers, and web developers to explore what can be done with spatial visualization and analysis to turn crowdsourced data into actionable information. We are just beginning to take advantage of the immense power of these techniques that can connect people in an emergency, change the conversation to promote spatial awareness, and make it easier to take action on community reports by using spatial analysis to connect the dots.