ArcWatch: GIS News, Views, and Insights
May 2012
Community Planning: A New App for Collaborative Geodesign
Combining GIS and design presents an opportunity to merge art and precision, geography and graphics, the human mind and creativity. The software that has resulted continues to redefine how we work with a GIS—not just cartographically, but conceptually. It allows us to capture the many processes and workflows any designer might undertake.
When a new plan for a community is created, there will likely be multiple stakeholders, all with their own visions and ideas. Each stakeholder's contribution is important so the plans submitted need to be captured, analyzed, compared, and evaluated.
The new Community Planning web application from Esri demonstrates how GIS and the web can provide a collaborative design tool that can capture the visual qualities of a design, along with multiple scenarios, and save the design to a central location. From there, the design lives as data, and with that comes the ability to perform the spatial analysis and evaluation available in a GIS.
This application uses a combination of ArcGIS for Server and Adobe Flex. The new feature service in ArcGIS 10 for Server lets you execute queries to obtain features and perform edits, which can then be applied via the server and published to the web. Once a service has been published, a programmer then uses ArcGIS API for Flex to build an interactive rich Internet application that consumes an ArcGIS for Server feature service. Web collaboration is born!
Here's how to use the new Community Planning web application.
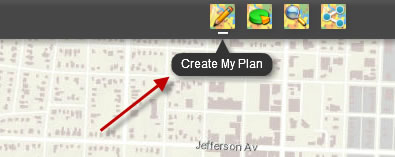
Step 1: Navigate to the Community Planning web application.
Along the top menu bar, click the Create My Plan button. This reveals a panel of features that can be drawn on the map, as well as a field to enter a plan name and your e-mail address. Your e-mail address will serve as your identifier in the design collaboration process.
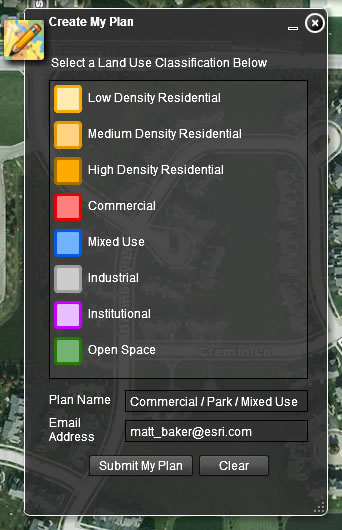
Creating a Plan
Step 2: From the Create My Plan palette, click a type of land use to enable it for sketching, and click the map to add the shape of the polygon. As you click, you can see the feature being added to the map. Double-click to finish the sketch. If you want to change the feature's shape, click on it to select it, which reveals handles at each node you added. Drag a node to move it, or pause the pointer on an edge to reveal a new node you can add to the shape.

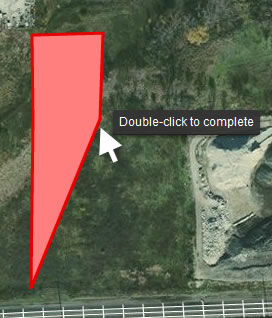
Sketching and Modifying Features
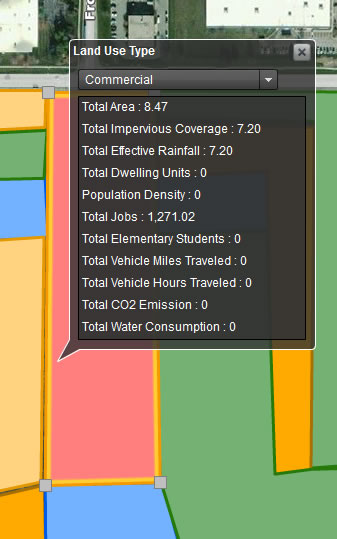
Step 3: If you click any feature you've drawn, a pop-up window will appear that summarizes the attributes in the feature and the indicator values that can be measured based on the area of the feature.
What makes this application powerful is the ability to draw data. The area, length, and location of features added to the plan are already known by the GIS.
Planners know from researching existing plans that environmental, economic, social, and other indicators can be measured based on the area of a particular feature. With the use of Flex and a simple multiplication factor, a value for an indicator can immediately be calculated as a function of the area the feature represents on the map. For example, if an acre of commercial land use can generate 150 jobs, 4.5 acres will generate around 686 jobs.
Measuring the Impact of Your Design
Step 4: Click the Community Impact button on the top menu to reveal a charting widget, which compares the areas of all the land-use types and each indicator, giving a visual measure of proportion to the land-use plan. This chart will also update as you draw more features, giving you live feedback on the quality of your design.
The indicators chosen for this application were pulled from various planning manuals and guidelines, such as the American Planning Association's Planning and Urban Design Standards and The Smart Growth Manual.
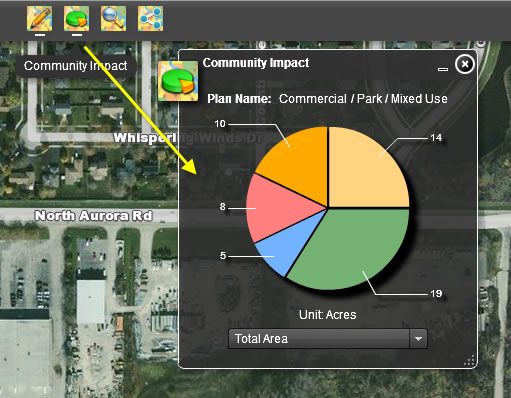
Charting Indicator Values
Step 5: Click the Review My Plan button to reveal a widget that will show all the plans you have already submitted that are tied to your e-mail address. Clicking each plan retrieves the plan from the server, allowing you to reevaluate it, edit features, and resave the plan to the server.
When you click Submit My Plan, you are creating a space on a GIS server that stores the features and attributes you draw on the map.

Submitting Your Plan
Step 6: This application also gives you the ability to share your unique plan with the rest of the world. Clicking the Share My Plan button reveals a widget with options for sharing a link to your plan via Twitter, Facebook, or e-mail.
When users on the other end click the link, they'll be taken to the application and a map showing your plan.
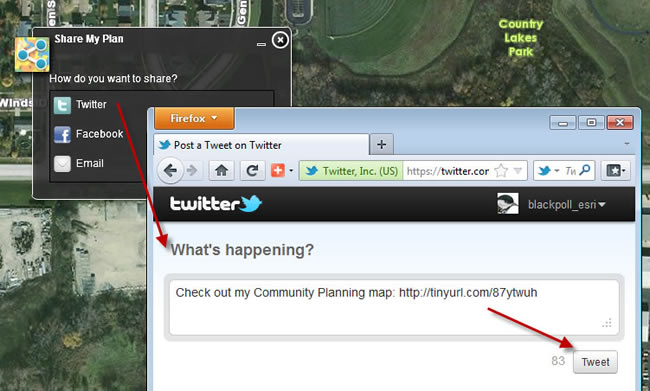
Sharing Your Plan
Step 7: Your plan is stored in a database, and since your e-mail address serves as your identification, you can retrieve any plan you've submitted by entering your e-mail address. Clicking the name of one of your saved plans will add it to the map. You can edit it, add features, and otherwise review multiple scenarios.
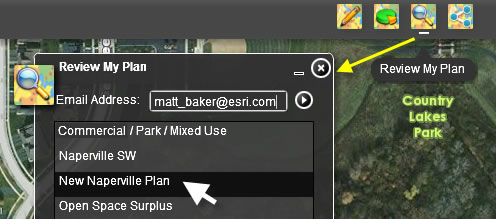
Retrieving Your Plan
Citizens now expect up-to-the-minute news about their communities, and they also will come to expect updates on plans for future development. Today's web technology allows instant communication through many channels and data types. ArcGIS for Server gives you the opportunity to make maps and GIS data part of this exchange, offering planners and designers the ability to post a design, share an idea, and receive feedback from other stakeholders and community members as instantaneously as they receive Tweets from friends.