ArcWatch: GIS News, Views, and Insights
May 2012
Esri Technology Guides Athletes in a Race at the End of the World
Maps Created with ArcGIS Also Provide a Topographic Record of Patagonia to Benefit Conservation
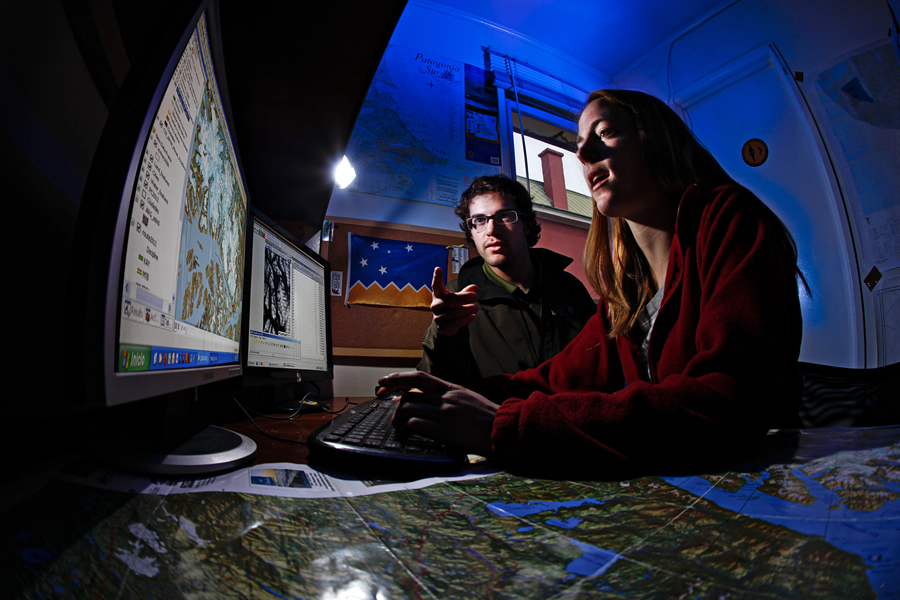
Patagonian Expedition Race cartographers Jason Blair and Katie Panek modify the race route according to the latest data in ArcGIS.
Maps created using GIS helped the athletes competing in the Patagonian Expedition Race hike, bike, and kayak across the often dangerous topography of southern Chile in a 10-day physical and mental contest—often referred to as "The Last Wild Race."
Before this year's 375-mile race in Patagonia, a vast region of diverse wilderness located at the southern tip of South America, each racing team only had a crude, small-scale overview of the country's topography to guide them along their route. This year, race organizer Nómadas International Group wanted to give racers a more comprehensive view of the course to help the athletes safely traverse Patagonia's glaciers, rivers and mountainous terrain. To do that, the group enlisted its staff cartographers Jason Blair and Katie Panek to create maps of the route using Esri's ArcGIS technology.
ArcGIS served a dual purpose by giving the racers a more detailed cartographic picture of the race route and providing a new topographic record of Patagonia for the benefit of ecological research.
Better Maps for Informed Conservation
The Patagonian Expedition Race, which celebrated its 10th anniversary this year, has a larger purpose than pure competition. "The race calls attention to the uniqueness of the region," says Jack Dangermond, president of Esri. "GIS technology used to create maps for the race will also inform the work of conservationists trying to understand complex relationships within Patagonia's ecosystem."
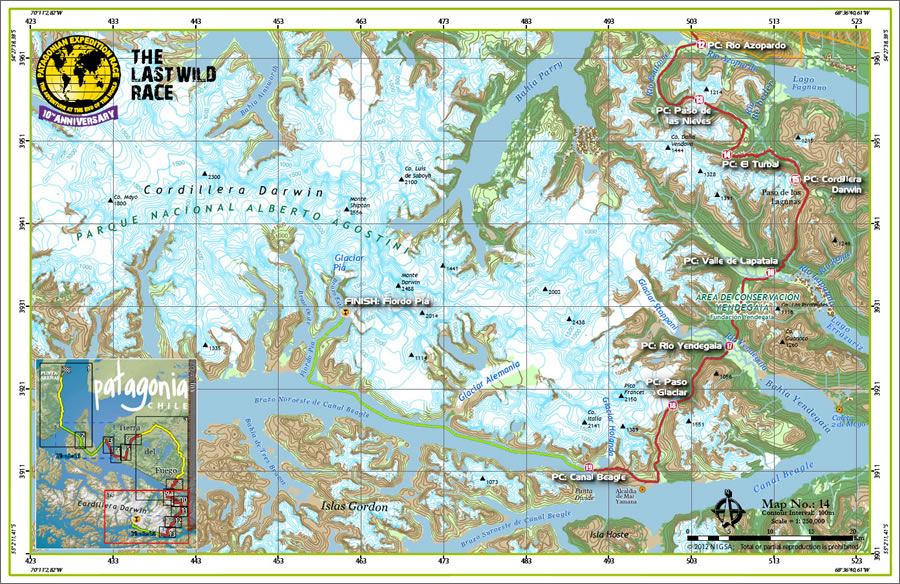
The route of the Patagonian Expedition Race.
Nómadas International Group aims to raise $20,000 before the end of the next race to enable scientific tracking of the guemal population—a critically endangered Chilean deer species—and more closely monitor logging activity and its effects on wildlife in the region. Constructing a more thorough cartographic picture of Patagonia will be invaluable in reaching that goal.
To successfully cross Patagonia's ever-changing terrain, the athletes needed maps that included the latest available data on the region. Potential obstacles, such as deep snow and glaciers, are constantly in flux due to Patagonia's dynamic and unpredictable climate. (Last year, several racers were blown off their bikes by a freak windstorm on a seemingly mild day.)
Building the Maps
To begin plotting this year's race course, founder and director of the Patagonia Expedition Race Stjepan Pavicic digitally plotted the route based on his extensive experience hiking the mountains of Patagonia. Blair and Katie Panek loaded the file of the route into ArcGIS for editing and modified the route based on the latest data on the region. They obtained that data using online sources, such as digital elevation models from NASA and publicly available Landsat imagery.
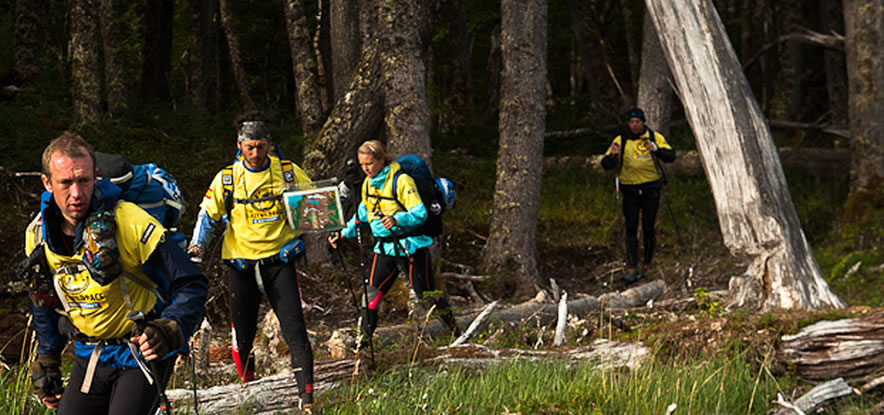
The Adidas TERREX Prunseco team treks the Karukinka trail in southern Tierra del Fuego. Photo by Tony Hoare.
Compared to natural parks in the United States and Europe, Patagonia's remote backcountry has virtually no topographic record. Not even old maps representing the region were available. "ArcGIS software helped facilitate creative approaches to mapping data and solving geospatial problems in uncharted areas within the park," says Pavicic.
"We digitized features by hand, organized them within a geodatabase, and processed it in ArcGIS," says Blair. "We also conducted watershed analysis in ArcGIS to determine the location of major river networks and potential streams. The ability to view the surface water system is critical when planning the route to avoid hazardous situations. The landscape of the region required crossing large rivers throughout the route, which we were able to plan for in advance to allow a safe crossing for the racers and volunteers on the course."
Blair and Panek created an accurate vegetation layer for the 2012 race maps using combined information from different government sources and layers that they digitized from satellite imagery." The vegetation maps were particularly helpful in planning the official route for the race. Hillshade, annotation, and symbology were added to all the race maps.
Adventure is the Prize
The Patagonian Expedition Race consists of 20 four-person teams, each with a designated navigator. The race in February 2012 tested the athletes' mettle as they crossed choppy rivers, hiked slippery glaciers, and biked up and down treacherous mountain terrain. Team Adidas TERREX Prunesco, representing the United Kingdom, took first place in this year's competition.
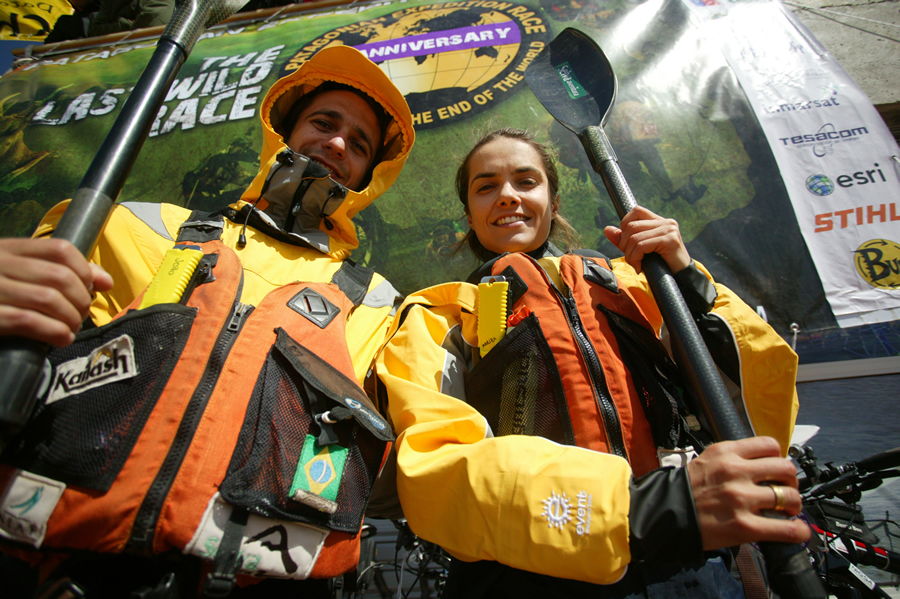
Two of the athletes from the Brazilian team GO Crazy pose at the finish line after completing the grueling race. Photo by Valentino Saldivar.
Winners receive no monetary prize; instead, racers get their motivation from the personal journey through wild southernmost Chile—a region so remote that most people only experience it through literature. "One of the things that struck me was that we were racing in the Magellan Straits, the Darwin range, and the Beagle Channel—the kinds of places you read about in books," says New Zealander Stuart Lynch, one of the members of Team Adidas. "It's quite a cool thing to come here and race at the end of the world."
Participants from 20 countries negotiated the natural landscapes guided only by their orienteering abilities and maps. This year's route took racers into the Cordillera Darwin, a high-altitude region of Tierra del Fuego covered with glaciers and peat bogs.
Distributing the Maps
Race officials distributed the map sets to participants and members of the media to plan and navigate the course through Tierra del Fuego. An overview map of the entire route included major streets for journalists and race organizers to follow to get them from the Patagonian capital Punta Arenas to various points along the course. The media used the basic overview map of the entire course to determine the ideal locations to visit during the race.
The maps were not handed out until the day before the race, giving the teams only 24 hours after seeing the route to make final preparations and adjustments to their race strategies. "Each team's navigator received one set of maps," says Blair. "Navigators assumed responsibility for interpreting the maps and guiding the team through the course." Each map set consisted of 18 printed maps at differing scales for different needs. For example, the overview of the race course and surrounding region was provided at a 1:750,000 scale. More specific maps for navigating mountain bike trails and kayaking were scaled smaller.
The finish line with a station manned by race sponsor Wenger, maker of the Swiss Army knife. Photo by Valentino Saldivar.
"We wanted to keep the number of maps to a minimum to decrease weight and confusion, so we decided to use the smallest scale that would be practical for each segment of the race," says Blair. "The mountain biking routes were very straightforward, typically following dirt roads, and did not require any complicated navigation. Therefore, smaller scale maps [1:200,000] were acceptable. However, the trekking sections did not follow any trails, and the course is simply a suggested route, so by providing a large-scale map [1:50,000], the teams were able to determine the best route for travel and safely navigate the complicated terrain with a detailed map."
In case the maps got lost, each team loaded the race route and mandatory checkpoints into a GPS for emergency use that was sealed prior to the start of the race. Breaking of the seal during the race disqualifies the team.
"ArcGIS software facilitated creative approaches to mapping data and solving geospatial problems in uncharted areas," says Pavicic. "Helping to improve the quality of maps available for Tierra del Fuego in Chilean Patagonia will result in long-term benefits for the people and environment."
Watch Blair and Panek talk about their mapmaking project in this video.