ArcWatch: GIS News, Views, and Insights
May 2012
The Power of Mobile Situational Awareness
During the Worst Floods in Australia's History, Mobile GIS Provided Responders with Valuable Information for Decision Making
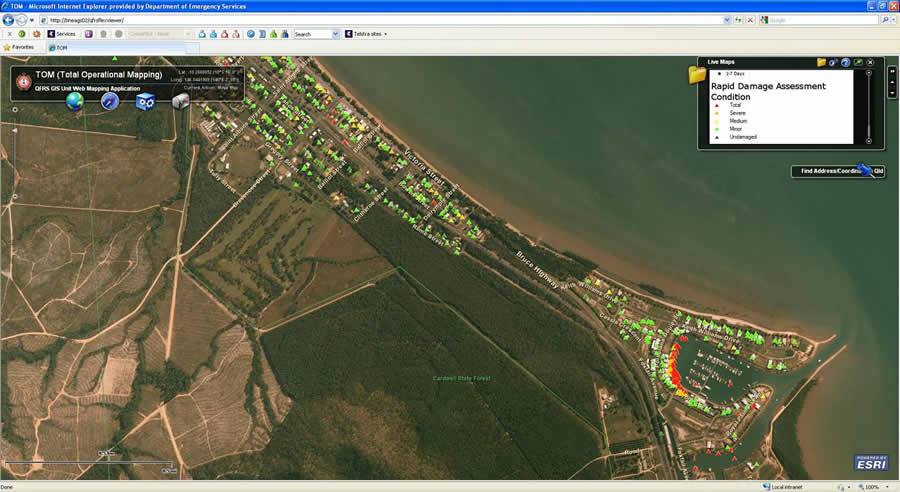
Queensland Fire and Rescue Service's Total Operational Mapping (TOM) showing rapid damage assessments (RDA) after Tropical Cyclone Yasi struck Queensland, Australia on February 3, 2011. The red triangles in the marina at Cardwell represent luxury boats piled on top of each other.
Utter destruction.
That was what was left in the wake of apocalyptic-like floods that swept through Queensland, Australia, in late 2010 and early 2011. Thirty-seven people died. Cars were swept away. Homes; businesses; and infrastructure, such as roads, bridges, railway lines, and pipelines, were destroyed or badly damaged. The toll on crops, such as cotton and sorghum, and the region's coal industry also was high.
The floods impacted at least 70 towns and over 200,000 people and caused an estimated $5.8 billion (Australian) in damage. Queensland cities that experienced flooding included Brisbane, Rockhampton, Emerald, Bundaberg, Dalby, Toowoomba, and Ipswich.
To assess the damage, the Queensland Fire and Rescue Service (QFRS) used GIS to map conditions such as flooded roads and damaged buildings, providing near real time situational awareness for officials directing the response and recovery efforts.
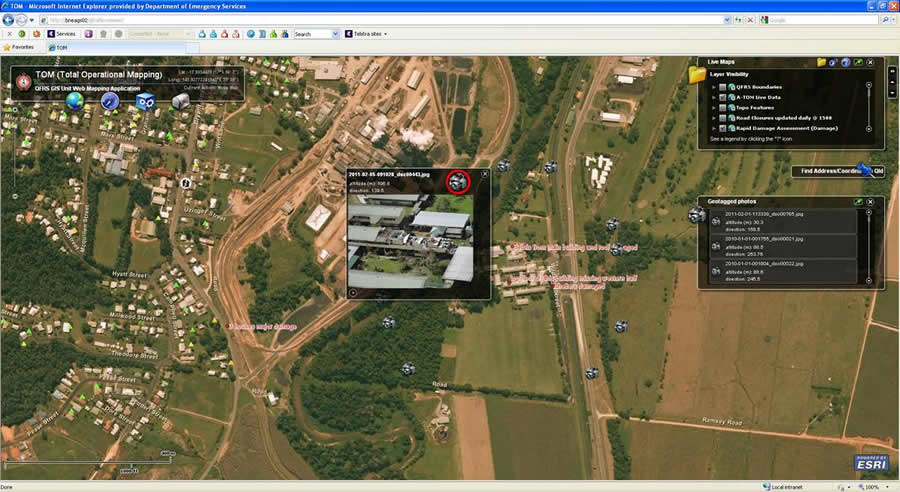
TOM showing georeferenced photos of Tully High School taken from a helicopter after Tropical Cyclone Yasi.
As soon as the flooding began in December 2010, QFRS deployed mobile GIS to collect information that would give both commanders and frontline responders valuable intelligence. Using mobile GIS to capture data from land and air provided a real-time understanding of the damage caused by the floodwaters. The information gathered helped direct and redirect efforts that would minimize damage.
"You need close coordination and information exchange between the field and emergency operations centers," said Mark Wallace, GIS Unit, Queensland Fire and Rescue Service, Department of Community Safety. "And this often happens under the most stressful, chaotic conditions."
Mobile map and tabular data captured in the field by QFRS special operations staff and QFRS air observers was easily integrated into a GIS-based common operating picture called Total Operational Mapping (TOM), which is a web-based viewer available on any QFRS computer. The data was then analyzed, visualized, and shared, providing situational awareness for a more informed disaster response.
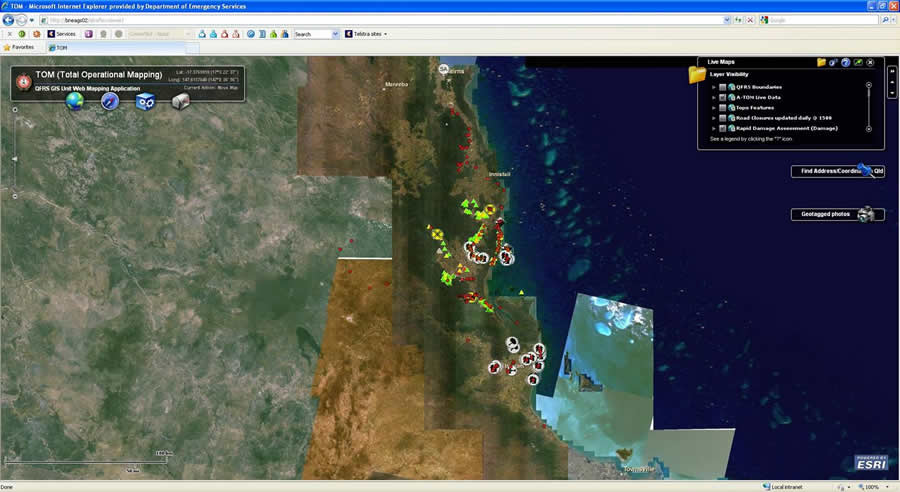
TOM showing RDAs and data collected using A-TOM after Tropical Cyclone Yasi.
"Mobile GIS replaced a paper-based workflow," Wallace said. "Before, someone would mark up topographic maps illustrating damage or impact while in the air carrying out reconnaissance, land the aircraft, and then drive the marked-up maps back to an incident command center. The same data collection workflow also happened on the ground. This was very slow, and often the information was out of date before it reached people."
Deploying Mobile GIS for the Queensland Floods
Unrelenting rain caused widespread flooding in Queensland throughout December 2010 and January 2011. Then on February 3, residents were dealt another blow. Tropical Cyclone Yasi, a category 5 cyclone packing winds up to 285 kilometers (180 miles) per hour slammed into Queensland. Australian responders-firefighters, law enforcement officers, medical staff, and others-were immediately activated. The damage was great due to the size and complexity of the storm. Wind, rain, and floodwaters caused terrible destruction along a massive swath of the country.
One of the first needs for all emergency operations is incident impact and overall assessment data. What exactly is happening on the ground, and how is the emergency evolving? For the cyclone, which eventually caused massive flooding, mobile GIS was part of the responders' toolkit.

A-TOM also has been used for capturing fire-related data from an aircraft. The TA symbols stand for threatened assets such as houses threatened by a fire.
QFRS's GIS unit developed the Aerial-Total Operational Mapping (A-TOM) solution. It was originally created for QFRS's Air Operations Unit in 2006, when that unit was trying to capture fire line locations with handheld GPS units.
"The quality and accuracy of the original system was poor," said Wallace. "We needed to provide more accurate, near real-time fire intelligence during an incident to support both strategic and tactical decision making. That led us to develop a better solution, which helped immensely during the storm and floods."
Based on Esri's ArcGIS for Windows Mobile technology, the second-generation A-TOM system provided a simple, easy-to-use tool for the initial gathering and mapping of information from the air during the Queensland floods. It worked with or without network connectivity.
Observers in fixed-wing and rotary (helicopters) aircraft flew over flooded areas using a touch-screen mobile device to capture information in a georeferenced form. Conducting this initial situation report from the air provides the first understanding of what a disaster looks like, as well as its current and potential impacts to life, property, and natural resources. Emergency personnel can also make observations from the safety of an aircraft, far above the danger on the ground. The initial aerial observations, illustrated on the mobile mapping application, were immediately sent back to the incident control center with the touch of a button on the mobile device. If connectivity was an issue, once the plane landed, the digital information could be hand delivered and uploaded by simply connecting the mobile device to the geospatial server powering the common operating picture.
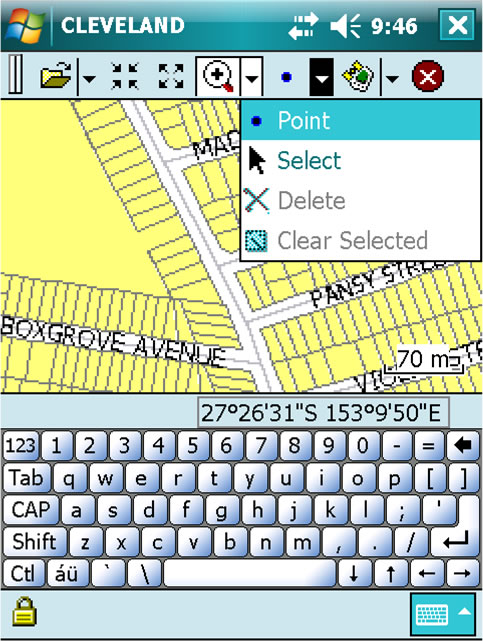
Collecting a point during the RDA process using a Trimble Nomad.
Aerial observation data was put into the TOM system. TOM is an implementation of the Esri common operational picture (COP) Flex viewer that is built on ArcGIS for Server.
Once the mobile A-TOM data was integrated into the GIS-based TOM common operational picture, it was immediately visible to QFRS incident controllers coordinating staff and equipment. They could accurately pinpoint water damage extents, community impacts, infrastructure damage, road washouts, downed power lines, and damaged railways. The highest-priority evacuations, road closures, power restoration, medical facilities, food distribution, and temporary shelters were easy to ascertain. This helped during the initial phase of the disaster response.
After the floodwaters receded, QFRS urban search and rescue teams then used the initial intelligence gathered via A-TOM to carry out more than 8,000 Rapid Damage Assessments (RDAs) using Esri ArcPad mobile GIS software on Trimble Nomad devices. The data became the baseline for measuring the status of the reconstruction effort; in addition, the information was supplied to insurance companies to help speed up the payment process from the claims.
For the RDA collection process, firefighters walked down the streets of impacted areas carrying Trimble units. They would visit each structure and property within a predetermined search grid, make an assessment, capture the exact latitude-longitude, and collect the following data on the digital form:
- Building condition-Undamaged, minor, medium, severe, or total
- Occupied-Yes/No
- Building levels-1, 2, or 3+ (i.e., number of floors in the building)
- Building type-House, commercial, industrial, school, place of worship, other
- Required tarping-Yes/No
- Hazards affecting the site (i.e., electrical hazard, sewerage hazard, animals [e.g., aggressive dog]), trees, or landslip)
- Comments
This data was then sent to headquarters for analysis and display in TOM on ArcGIS for Server. Information could then be shared via web mapping, hard-copy maps, and statistical reports created using Microsoft Reporting Services.
The RDA data was analyzed in three primary areas: operational, strategic, and political.
- Operational
A web-based mapping view of field data helped emergency incident controllers allocate staff, vehicles, and supplies. Map patterns showed hot spots where immediate action needed to be taken. - Strategic
Strategic analysis helped the incident coordinators make decisions as they supported the incident controllers who were doing operational duties. Incident coordinators could answer questions such as, Do we need to move resources from one part of the state to another to support that community? and What do we need to do to make those resources available to the relevant incident controllers? - Political
Politicians used analyzed A-TOM/RDA information to better communicate and inform the public. Media conferences were held and maps displayed that showed the number of properties with a certain level of damage, the number of properties per community that had been assessed, the number of people to be relocated, long-term community-based plans for rebuilding, and much more.
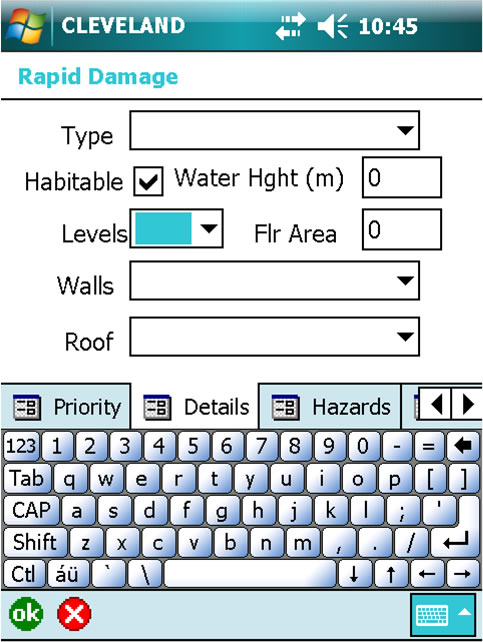
To assess the flood damage, firefighters went out into the communities and collected data such as the building type and whether or not the building was habitable.
"The field data and subsequent analysis provided an excellent base for recovery efforts," Wallace said. "They were provided to a wide range of agencies including other state and local government departments, utility companies, insurance organizations, and more."
Improving Disaster Response
According to QFRS, the investment in GIS technology by the Department of Community Safety, in which QFRS is one of the operational divisions, was important in improving response to natural disasters, especially the Queensland floods. Through the widespread use of mobile GIS, near real-time situational awareness was attained. Information could be continuously updated as needed from the field. Limited resources were sent to where they could be most effective. Everyone operated using the same GIS-based COP. Public communication was enhanced using accurate digital maps, and long-term recovery requirements were more accurately assessed, prioritized, and monitored.
"In our response to the Queensland floods, we saw a major cultural shift in the way map information and the underlying analysis was used," Wallace said. "Maps benefited more than just first responders and full-time GIS staff because the timeliness and accuracy of information collected was better than ever before. It let people working at each level quickly view information vital to their jobs."