Demographic and Economic Changes in the United States Affect Nearly Everyone
By Brent Roderick, Esri Product Marketing
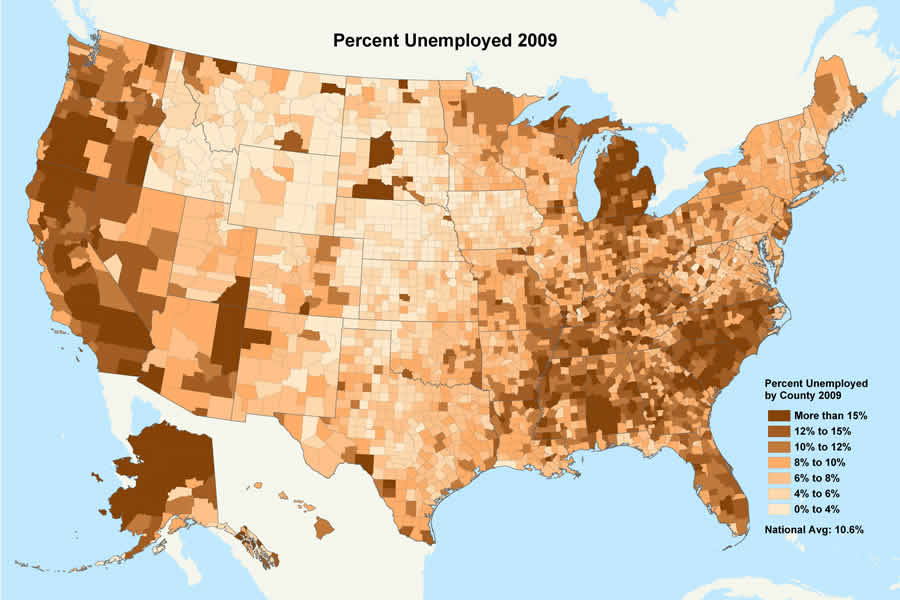 This map shows the unemployment percentage rates by county across the United States. |
Trends in Esri's newly released 2009/2014 demographic data updates confirm the recession's impact on housing, income, and employment that we've been hearing and reading about for months. Who is being affected by this serious recession? Nearly everyone. Changes in the nation's economy have become extremely personal. In the past year, 1 in 25 jobs was lost to the economic crisis and 1 in 42 homes was threatened by foreclosure. Households not touched directly by the loss of home or employment are experiencing low or no income growth, lower home values, loss in their savings or retirement funds, higher credit costs, cutbacks in services from struggling state and local governments, or the closing of a favorite local business.
Esri's 2009/2014 demographic data updates identify areas of high unemployment, activity in the housing market, rising vacancy rates, reduced consumer spending, changes in income, and increased population diversity. Updated data variables, such as population, housing, age, income, and home value, ensure that analysts can conduct their research with the most accurate information available, particularly for fast-changing areas.
Esri's 2009/2014 data updates have been released for more than 2,000 variables including the 2014 forecasts and are available in multiple geographies ranging from national to block group.
Esri continues its tradition of providing accurate demographic data based on its proven update methodologies to enable the most precise small-area analysis at any geographic level. Accuracy is the credo for Esri data. For example, Esri identified the beginning of the bursting housing bubble and the emergence of the damaging effect of subprime mortgages fully two years before the market actually collapsed.
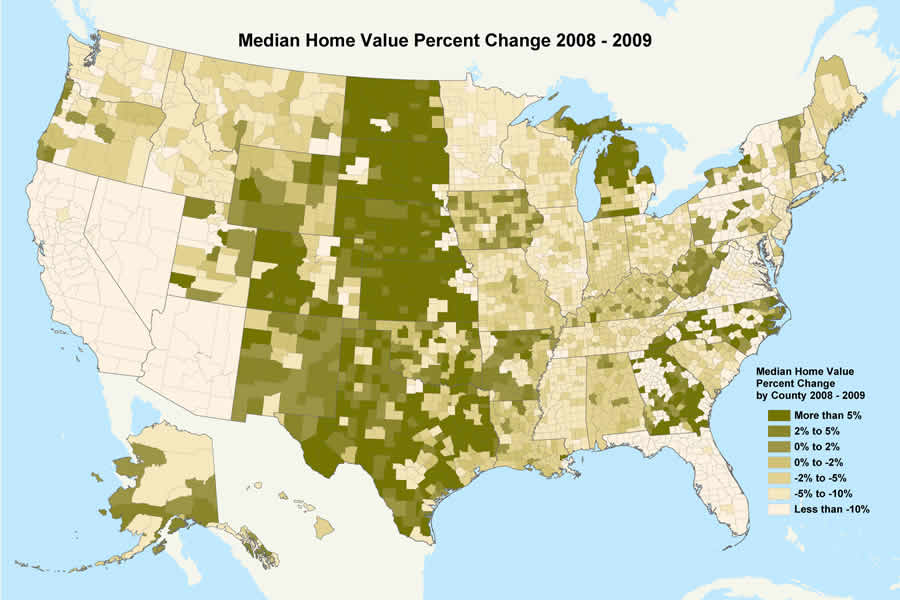 Median home values rose in most of North and South Dakota, Nebraska and Kansas, and parts of Oklahoma and Texas. |
"Esri pays close attention to economic and social trends and how they influence the needs of business, consumers, and citizens. The challenge of the current market underscores the importance of information," says Lynn Wombold, chief demographer and manager for data development at Esri. "Our data strategy provides consistent forecasts and year-on-year data solutions that enable analysts and knowledge workers to be confident that the analysis they perform this year will be valid and applicable next year, and even in five years' time. Current data can track critical changes and preclude the cost of being wrong." Three demographic trends, taken from the Esri Demographic Update Methodology: 2009/2014 white paper, show that
- The housing market is a reflection of the slumping economy. Three years of significant growth in foreclosures have left quite a wake in the housing market; for example, the 2009 median home value for the United States is $162,000, down 11.3 percent from 2008. In 2008-2009, the median home value declined in more than two-thirds of U.S. counties. Vacant units increased by more than 8 percent; the U.S. vacancy rate now stands at 11.2 percent.
- Unemployment is a lagging economic indicator. Esri estimates the number of jobs lost will be 5.6 million by mid-2009, with an unemployment rate of 10.6 percent (Esri's employment data is not seasonally adjusted). This loss negates more than 80 percent of the job growth realized since 2000. Nationally, the loss represents 1 in 25 jobs; however, the 4 percent decline is not consistent across the country. Hardest-hit states, such as Michigan, North Carolina, and Oregon, show drops of 1 in 15 jobs. By county, the steepest employment declines represent 1 in 8 jobs; by ZIP Code, 1 in 3 jobs.
- Median household income during calendar year 2008 (the first year after the start of the recession) was $54,700, an increase of 2.9 percent annually since 2000, but a slight decrease of 0.1 percent from 2007. Average and per capita incomes were even more unstable from 2008 to 2009. Average household income declined from $73,800 to $71,400; per capita income declined more than 3 percent to $27,300.
The 2009/2014 demographic data is currently available in more than 50 reports and maps from ArcGIS Business Analyst Online, Esri's on-demand analysis tool, and as ad hoc databases; it will be available soon in ArcGIS Business Analyst desktop software, the optional ArcGIS Business Analyst Segmentation Module, and ArcGIS Business Analyst Server, and from ArcGIS Online. Information from these reports can be used by organizations to analyze trends, identify growth, and make governmental or business decisions about expanding services and revealing new market opportunities.
For more information about Esri's 2009/2014 data, visit www.esri.com/data or call 1-800-447-9778.