Esri Releases 2010/2015 Updated Demographics Data
By Brent Roderick, Esri Product Marketing
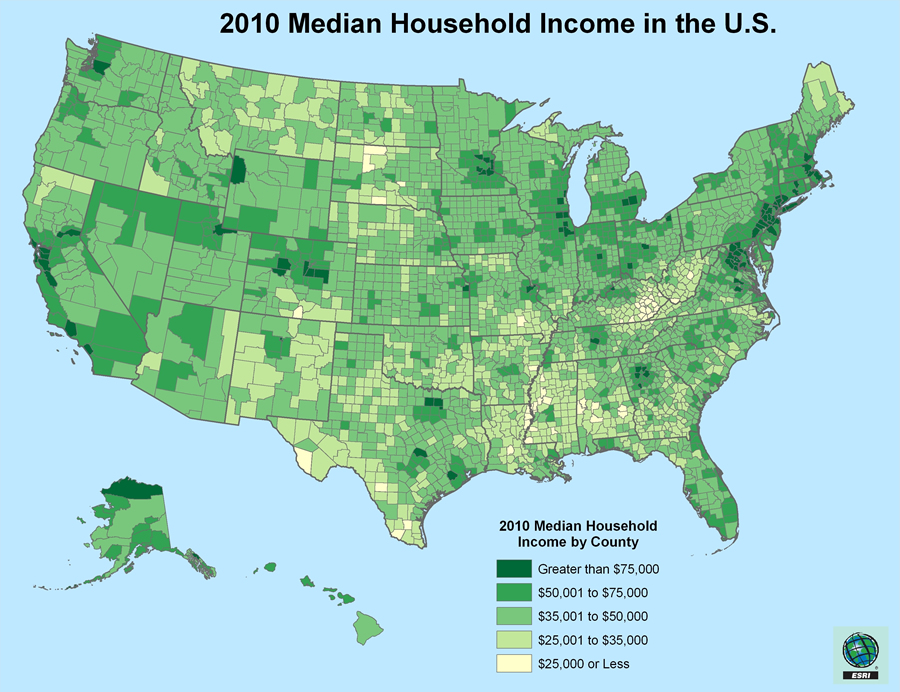 Median household income declined in 98 percent of U.S. counties. |
The newly released 2010/2015 Updated Demographics data provided by Esri reveals intriguing information about the demographic landscape in the United States.
Esri's 2010/2015 Updated Demographics data offers more than 2,000 data variables, including current-year estimates and 2015 forecasts for 11 different U.S. geographies from national to block group levels. This data can help identify areas of high unemployment, adjustments in the housing market, rising vacancy rates, changes in income and consumer spending, and increased population diversity. Agencies, businesses, and organizations can use the data to analyze trends, identify growth, and reveal new market opportunities.
"The challenge of successfully weathering the current economy underscores the importance of having access to accurate information. Current data can track critical changes and preclude the cost of being wrong," says Lynn Wombold, Esri's chief demographer and manager of data development. "Esri pays close attention to economic and social trends and how they influence the needs of businesses, consumers, and citizens."
Here are some highlights from the 2010/2015 Updated Demographics data
Income: U.S. households are still feeling the pinch of the recession. The median household income for 2010 is $54,442, down slightly from $54,719 in 2009. In 98 percent of U.S. counties, median household income has declined. Average household income dropped even more, falling from $71,437 to $70,135.
Housing: The first quarter of 2010 saw foreclosures jump by 16 percent over the comparable period in 2009. Short sales are still impacting the market in some areas. Housing unit vacancies rose by 7.4 percent, pushing the overall U.S. vacancy rate to nearly 12 percent.
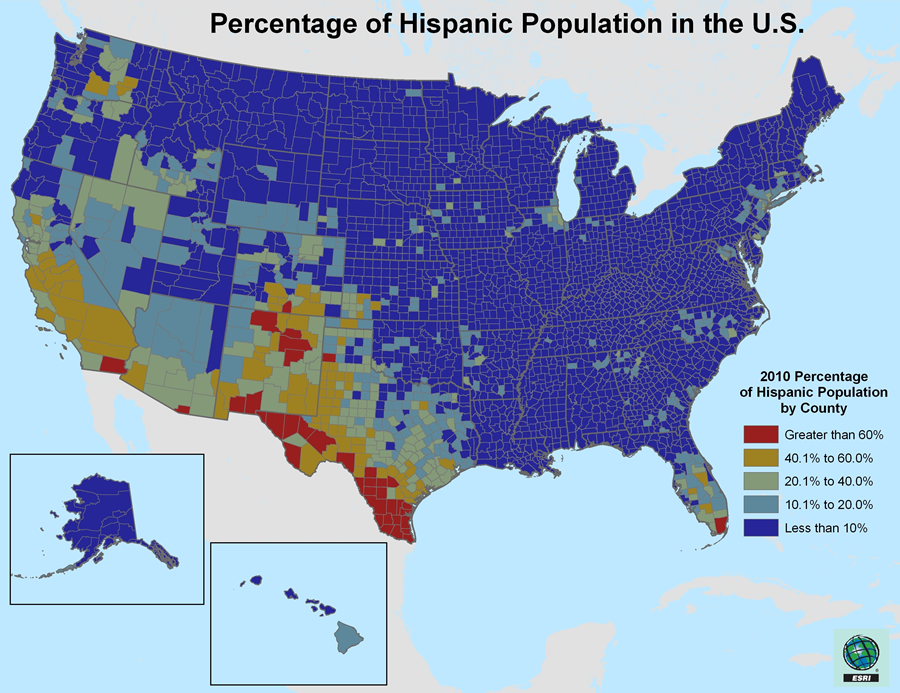 Growth of the Hispanic population is the greatest in counties in Texas, California, and New Mexico. |
Population: The U.S. population continues to change and diversify. Population growth and change slowed in most markets due to fewer births and the inability to move because of the recession. Ten states, including Florida and Michigan, lost population from 2009 to 2010; more than half of all U.S. counties also lost population.
Diversity: The most diverse states in 2010 are California, Hawaii, New Mexico, Texas, and Nevada. At 50.5 million, Hispanics now comprise 16.2 percent of the total U.S. population. From 2000 to 2010, this segment grew at an annual rate of 3.5 percent.
The Asian population rose and now stands at 14.1 million, comprising 4.5 percent of the U.S. population. This segment grew at an annual rate of 3.2 percent from 2000 to 2010. Now numbering 9.3 million people and 3 percent of the U.S. total, the 2010 multiracial population also expanded and grew at an annual rate of 3.1 percent from 2000 to 2010.
The Updated Demographics data is being released in stages. Currently, more than 60 variables are available in the Demographic & Income Profile Report from Esri Business Analyst Online, Esri's on-demand market analysis tool. All the updated variables will also be available soon as ad hoc data and in Esri Business Analyst (desktop and server). For more information about Esri's 2010/2015 Updated Demographics data, visit www.esri.com/datawhatsnew or call 1-800-447-9778.