ArcWatch: Your e-Magazine for GIS News, Views, and Insights
June 2011
Newspaper Offers Online Flood Map to Keep Readers Updated on Rising Waters
Cloud GIS Solution Opens Information Floodgate
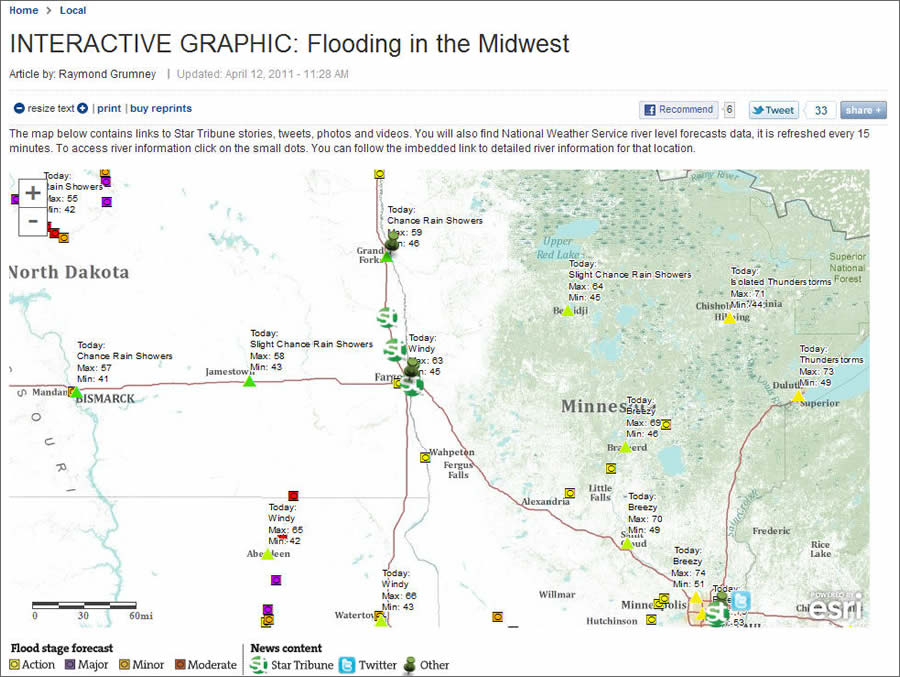
This Star Tribune interactive map linked to stories, tweets, photographs and videos related to the flooding.
This spring, the Star Tribune, Minnesota's largest daily newspaper, was awash in headlines such as "Red River Becomes the Red Sea" and "Farms Now a No-Wake Zone." Major flooding was damaging farms, prompting road closures, and uprooting families from their homes. The newspaper's reporters were on the scene, providing in-depth coverage of the crisis.
Online at Startribune.com, readers were kept apprised of flood conditions in western Minnesota and eastern North Dakota via an interactive web map created using Esri technology. Using the map, readers could see exactly where flooding and its effects, such as road closures and evacuations, were occurring.
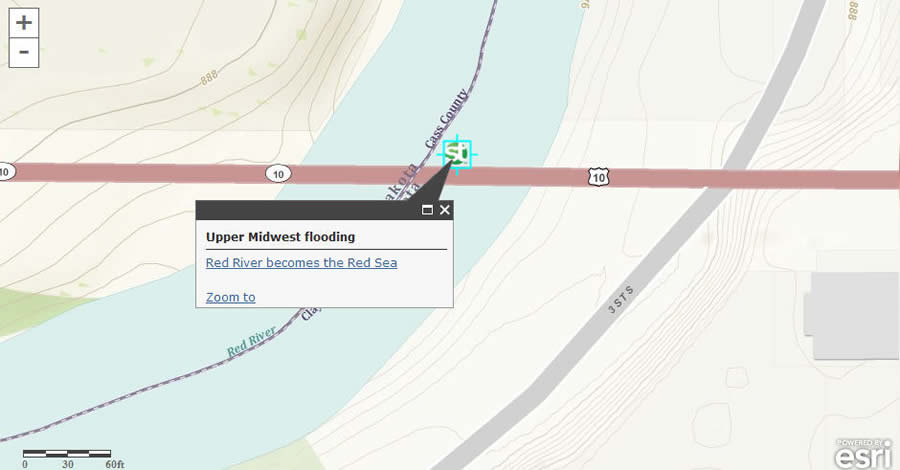
Links to the Star Tribune stories are displayed on the map using the newspaper's ST logo.
The map was created by the Star Tribune's Raymond Grumney, the newspaper's graphics director, with assistance from Esri's Minneapolis regional office. Grumney used Esri's ArcGIS Online, a cloud-based map service for maps and geographic data, to create the map. This service is embedded in the Star Tribune's web page. "We were looking for an application that was easier to update and maintain than the application we were currently using," says Grumney. "ArcGIS Online provides a solution that is inexpensive because it is hosted elsewhere, is easy to update, and provides us with a persistent application we can use whenever it is newsworthy."
Location information and links to detailed information from stream gauges, the Minnesota Department of Transportation (MinnDOT) event reports, and newspaper reporters' stories are available through links on the map.
When readers open the map, it centers on where Highway 10 and Interstate 29 cross, giving a view of North Dakota, South Dakota, and Minnesota. Readers can zoom all over the area and take a closer look at features such as landmarks, roads, and highways and live data feeds providing information on road conditions and river levels. They can turn on other layers of information, such as shaded relief imagery for added understanding of what they are looking at, as well as zoom all the way down to view building footprints.
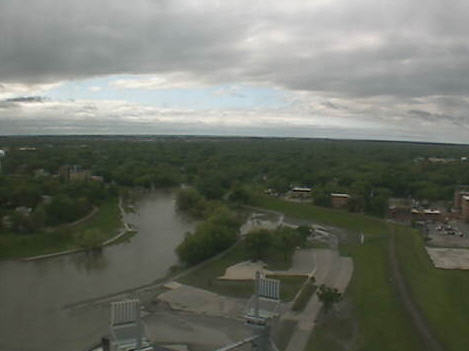
Readers who clicked on links to web cams could see live shots of the flooding. This image came from a camera in Fargo, North Dakota.
Reporting on the River
The Red River Valley is prone to flooding in the spring. Rapid changes from cold winters to warm summers, coupled with a flat, fertile terrain, almost guarantee that the Red, as the river is called, will swell. Star Tribune readers were able to follow reporter Bill McAuliffe as he was dispatched to the Red River Valley in Fargo, North Dakota, to cover the impact of flooding in the region. McAuliffe's articles and videos are linked to the geographic location of his stories on the map. "This really gives an added dimension of our storytelling," says Grumney. "Readers can in essence travel along with our writer as he follows the river flow, reporting on what he sees."
Along with a topographic map, the Star Tribune online map includes data such as administrative boundaries, cities, water features, parks, landmarks, highways, roads, railways, and airports. The map also consumes a live feed from stream gauges operated by the National Oceanic and Atmospheric Administration's (NOAA) Advanced Hydrologic Prediction Service (AHPS). AHPS provides information on current water levels and forecasts. The AHPS feed is available via a REST service and is supplemented by feeds from live web cameras located at points along the Red River in Fargo, North Dakota, and Moorhead, Minnesota. These are areas that historically experience severe flooding.
By providing near real-time feeds from the gauges on the Red River into the Star Tribune's map, the application makes river levels and flow volume data quickly available to the general public in one location. The service also includes forecasts such as how high the river will rise, when the river will reach its peak, where property will be flooded, and how long flooding will continue. This is important information that can be used to improve public safety. For example, by understanding where water levels are rising, remediation measures can be taken, such as directing crews to sandbag areas at risk of flooding or evacuating areas in advance of dangerous high waters. Forecasts can also help businesses plan for flooding and cut their monetary losses by efforts such as moving large assets and inventory from flood-prone sites.
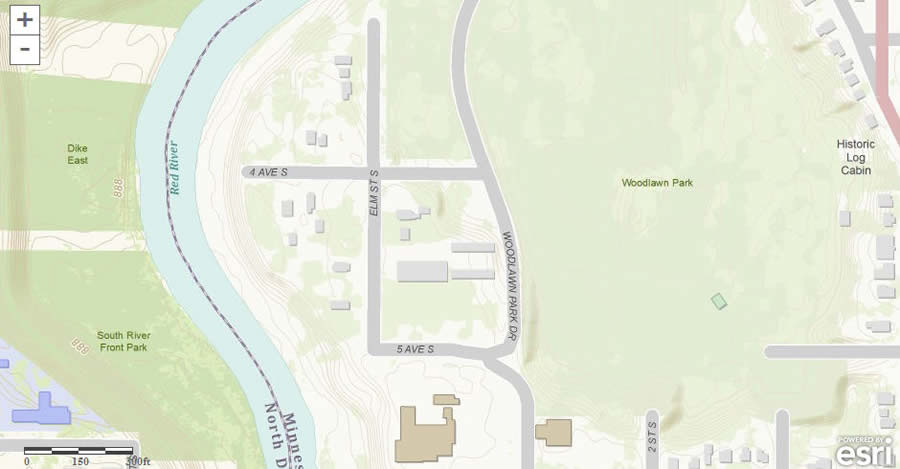
By zooming in on the map, readers can also see building footprints.
Revolutionizing Reporting
Links to the Star Tribune stories are displayed on the map using the newspaper's logo, a green dot with the abbreviation ST, allowing the paper to brand its stories, an important task as the Star Tribune, like other newspapers, strives to attract readership in a highly competitive industry.
Reporters are also able to use the map to help plan stories. Using GIS in this manner is not a new concept; newspapers like the Philadelphia Inquirer use Esri's ArcGIS software during news meetings to look at map-based data to discover trends, select areas, and query information. For example, the Inquirer's staff wanted to write about unemployment in the Philadelphia region and planned to sew together stories about people affected by the recession who lived near a main highway. Using GIS to view mapped unemployment data, newspaper staff found no real patterns in unemployment in the area they first thought would hold interesting stories. Instead, they found that a different area-Main Line, along the old Pennsylvania Railroad-had a high increase in the percentage of unemployment claims and dispatched the business writer to investigate the reasons why. Read more.
At the Star Tribune, providing reporters with live information from river cameras and information on road closure data from MinnDOT gives them up-to-date information quickly and easily. Staff can organize their day of reporting and ensure they will collect stories that have the most impact and be important to their readers.
The Star Tribune's map provides a common picture for anyone interested in viewing information about the flooding in the Red River Valley. With river level forecasts, newspaper articles, and information from the general public, the map is a one-stop shop for information on the current status of flooding in the region. For more information on how media organizations use GIS, visit esri.com/media.