ArcWatch: Your e-Magazine for GIS News, Views, and Insights
June 2011

Mapping Center: Your One-Stop Shop for Mapping with ArcGIS
Want to know what spider diagrams, pycnophylactic interpolation, or bump mapping are? Or, on a more practical level, do you need to know how to choose the right symbols for your map; select the appropriate geographic transformation; or decide which digital elevation model (DEM) dataset to use, given your map scale?
Esri Mapping Center (mappingcenter.esri.com) can help. Whether you're trying to gain broad knowledge about cartography or you need a specific answer to overcome a mapping obstacle, you can find help on Mapping Center, a website dedicated to helping you make great maps with ArcGIS software. So how do you get started?
The Mapping Center Blog
You could start by mining the Mapping Center blog, a great resource, with almost 250 posts since we launched the website in 2007. Much of the blog content is inspired by you, our users. Here, we can provide in-depth answers to questions you've asked us, clarify concepts that may not be covered in the software documentation, and give you step-by-step instructions (some with related downloads) to teach you novel mapping techniques you can use on your own maps. We also use our blog to introduce you to some of our maps, data resources, custom styles, and more great content that you can find on Mapping Center, ArcGIS Online, or even outside Esri.
 |
This is a detailed response to a question from a user who asked if it was possible for the symbols on the map to be represented by real-world ground units: Symbolizing Point Features Using Ground Units: Multiple Symbols |
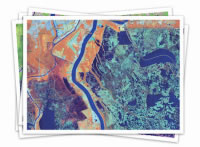 |
This post describes a new and really rich set of data that you can use to make a wide variety of maps, including image maps, land-cover maps, and animated land-cover change maps: Landsat Services Now Available on ArcGIS Online |
 |
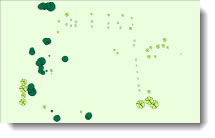
Here's an example of a blog entry on how to make a specific map, with related downloads that let you follow along, step by step: Aspect-Slope Map |
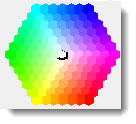 |
This compendium of web-based resources helps you with color, from picking the colors for your map to making sure that they are appropriate for readers who have difficulty distinguishing among colors: Color Tools for Mapmakers |
 |
Finally, here's a link to see what our most viewed blog entries have been: Curious? Our Most Popular Blog Posts to Date |
Ask a Cartographer
Send questions about your specific problems to Ask a Cartographer. We try hard to respond within a day or two. Our goal is to keep you moving forward in your work so that mapping roadblocks don't stop you in your tracks. You can choose to make your question public so that others can see what you came up against and how the problem could be solved, or keep it private so that the conversation is between you and us. We get all sorts of questions here, from brand-new users to experienced mappers, and we answer them all-nearly 1,500 of them to date!
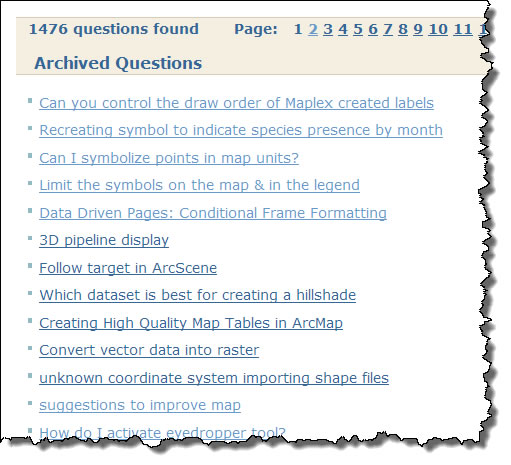
The Ask a Cartographer Archives
No single person here at Esri knows the answers to all your questions, so it takes a team to respond to your queries. Some of your questions stump us, so at times you will be asked to further clarify or share some of your data so the team can try out the solution before posting the response. Another great thing is that you can also comment on these questions and responses-sometimes providing alternative solutions or even better ones than we suggested. On the Ask page, as we call it, is our featured cartographer. You will see a different cartographer each time you refresh the page. The snippets of information will help you learn more about some of the most influential cartographers who helped shape the discipline. They are noted for their maps (e.g., Anaximander, who is thought to have made the first map of the world), map projections (e.g., Johann Heinrich Lambert, also affectionately known as "Mr. Frontal Lobes" because he was so smart!), cartographic concepts (e.g., Jacques Bertin, remembered for his critical Semiology of Graphics), and cartographic techniques (e.g., Eduard Imhof, known for his wonderful Swiss maps). We will soon introduce some new folks, too. See if you can find the one person featured who was not actually a cartographer!
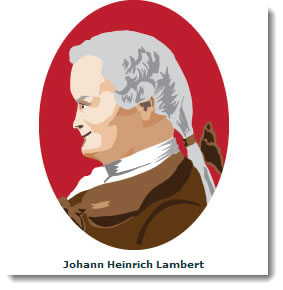
Lambert is one of the Mapping Center's featured cartographers.
ArcGIS Resources
On the ArcGIS Resources page, you'll find downloads to use in ArcMap, including ArcGIS styles, data, and what the Mapping Center team calls "loadable files" (for example, calculate statements, SQL queries, expressions, and abbreviation dictionaries). Many of the styles were developed in response to user requests. You can preview the contents of each style to decide if you want to download. For example, if you look at the Color Ramps style, you'll see that there is a whole new set of hypsometric tints to choose from. These will help you when you want to symbolize elevation (i.e., hypsometry) using a DEM because you can now choose the color ramp that relates to the part of the world you are mapping.
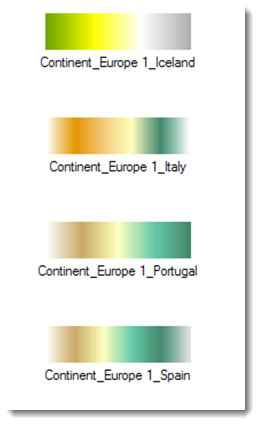
Here are just a few of the many color ramps in the Hypsometric Tints style.
You can also use the ArcGIS Resources page to find special models and scripts. Two of the most popular are the hillshade and the bump map tools. Use the former to create a beautifully hillshaded surface, like Swiss master cartographer Imhof described.
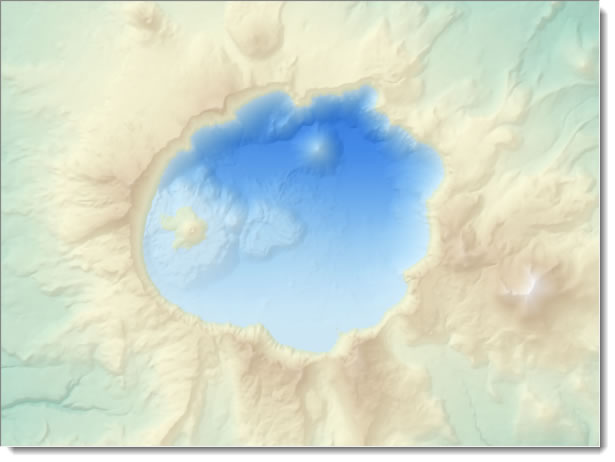
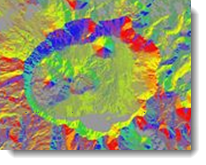
Results from Using the Swiss Hillshade Model
Use the latter to add texture to the terrain to symbolize vegetation, using a method that Jeff Nighbert of the Oregon Bureau of Land Management introduced using ArcInfo Workstation back in 2002!
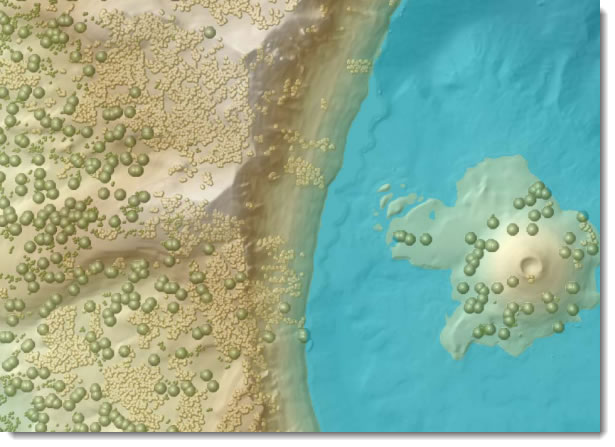
Results from Using the Bump Map Model
The ArcGIS Resources More page provides easy access to frequently used reference materials, including the functionality matrix of functions and tools that are available along with their license levels, as well as the map projection (i.e., projected coordinate systems) and geographic transformation PDFs that give you the specific parameters used in all our map projections and the associated transformations.
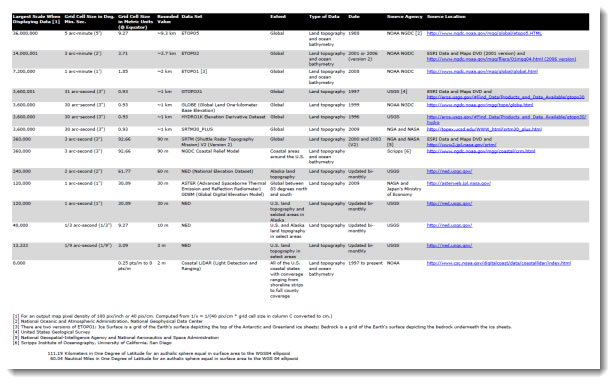
You can download the DEM Data Sources table.
Other Resources
On our Other Resources pages, you can find every presentation that members of the Mapping Center team have given and every paper we've written since 2004 and, in several cases, even earlier. Many have bottom notes of the content that was being discussed for each slide. Some of these notes include the step-by-step instructions for the techniques that were being demonstrated. The Workshops page includes the PowerPoint presentations and Word documents used in past training workshops. You can download and modify these for courses you teach, or just read them to learn about the mapping methods.
 Here are some of the many presentations you'll find on our Other Resources page.
The Esri Links page provides a quick and easy way to find cartographic content on other Esri websites, such as Esri Training, Esri Press, and Esri Support.
One of our favorite pages is called, not surprisingly, Cartographers' Favorites. Here links are posted to resources that many map makers regularly use, such as ColorBrewer, which can help you pick the right colors for your map or the David Rumsey map collection, which features an unbelievable collection of historical maps, some of which are georeferenced so you can load them right into ArcMap. You'll also see recommended reference books, textbooks, and journals - something that we often get asked about.
Downloadable Maps
From the Maps page, you can access maps that we have created. You can download these to learn about how the map was made. For each map, there are specific cartographic effects that are described in greater detail. In turn, these may link to ArcGIS resources that you can download to re-create the effect on your maps.
You will soon see important changes to this page as a lot more maps will soon be appearing, including print maps, single-scale and multi-scale web maps, and even web mapping applications with the interface for web map delivery. Mapping Center also is creating a new set of related pages with mapmaking techniques to teach you how to reproduce some of the cartographic effects you see on the maps.

Coming Additions to Our Maps Page
Connecting with the Social Network

Twitter was recently added to the Mapping Center home page, so we now can Tweet about our blog entries. Follow us at @mappingcenter. Twitter and Facebook buttons will also appear on all our maps and mapmaking technique pages, too. This way you can share your favorites with your friends and colleagues, injecting our content into your social networking. By following us on Twitter, you can keep up with the new content we are adding to Mapping Center's site.

Recent Tweets from Mapping Center
A Web of Resources
If you want to learn more about Mapping Center and how it was developed, check out the links on the sidebar of the home page. You can also find out more about the Mapping Center team.
Mapping Center wants to give you a true "web" of information and resources, connected by the common thread of helping you to make the best maps you possibly can. Explore and enjoy. Mapping Center is for you!

Esri Mapping Center Team