Kentucky GIS Portal Unlocks Data Needed for Emergency Response and Decision Making
By Jessica Wyland, Esri Writer
Tornadoes ripped through Kentucky, Alabama, Mississippi, Arkansas, and Tennessee in early February 2008, killing 54 people and injuring hundreds more. In the aftermath, rescue workers rushed to find survivors and prevent further calamity. The hardest-hit areas of Kentucky included the western counties of Allen and Muhlenberg, where seven people died when a cluster of storms leveled homes, snapped trees, and mangled vehicles.
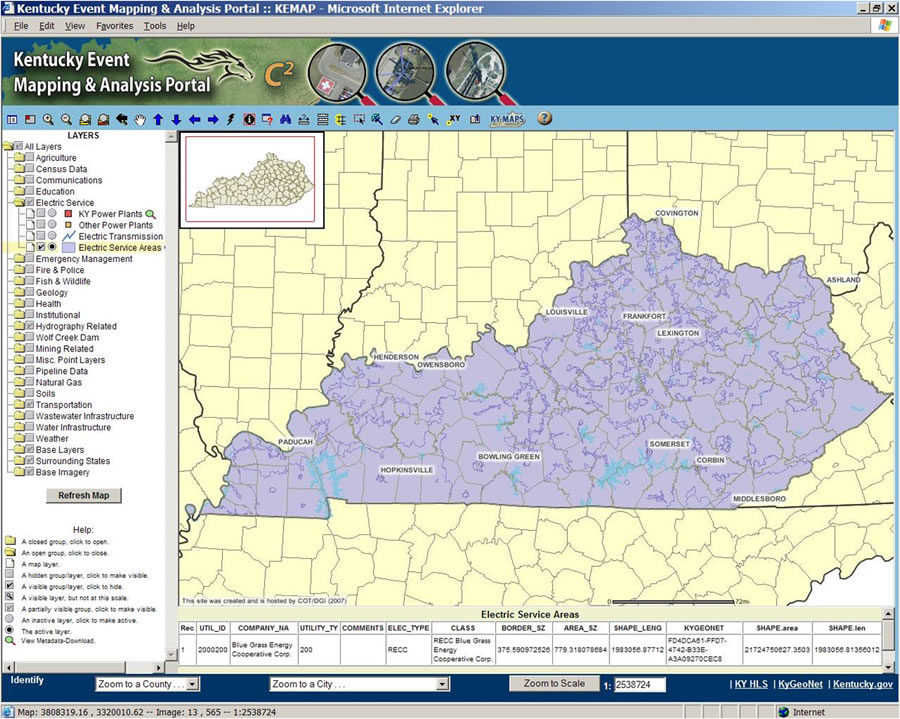 The Kentucky Event Mapping and Analysis Portal is an ArcIMS application with more than 150 layers. |
"It's obviously devastating what nature can do," Kentucky governor Steve Beshear told reporters following the tornadoes. "As bad as it is, it brings out the best in us. It's brought out the best in folks here. They're pulling together . . . cooperating. We're going to get ourselves on our feet again."
Integral to Kentucky getting back on its collective feet again in a rapid, organized fashion is the state's well-established geographic information system (GIS). The Kentucky Event Mapping and Analysis Portal (KEMAP) is a secure, password-protected service, built with Esri's ArcIMS software, that contains more than 150 data layers including roads, water, wastewater, electric, gas, telecommunications, agriculture, schools, hospitals, police and fire stations, and census data. Data stewards, such as the Transportation Cabinet and the Public Service Commission, provide the GIS layers. The portal was created for Kentucky Homeland Security, the National Guard, Kentucky State Police, Kentucky Division of Emergency Management, and other entities.
Esri's ArcIMS allows users to deliver dynamic maps, GIS data, and services through the Web in a highly scalable framework. The Commonwealth of Kentucky uses the solution, along with Esri's ArcGIS Desktop software, to publish, discover, and share geospatial information on its custom Web site.
Once the exact location of the emergency is determined, such as where the tornado touched down, KEMAP can be used to answer vital questions. Are there any homes, schools, or hospitals near that location? What electric and telecommunications utilities serve that area? What are the closest police and fire stations? How many people will be affected? Once key questions are answered, emergency responders can be deployed to the people and areas in greatest need.
KEMAP was developed by the commonwealth's Office of Technology's Division of Geographic Information following the devastating 2003 ice storm that lasted 36 hours and left more than 280,000 people without power, some for as long as four weeks.
"Utility service areas in the state are broken up into 330 polygons," said Ruth Rowles, GIS manager at the Public Service Commission. "GIS is so important because if you have outages in three different parts of the county, it may involve three different electric utilities. The electric service area layer quickly and accurately tells us what utilities operate in a particular area."
Kentucky has not had such a widespread emergency as the 2003 ice storm since KEMAP was instituted, so the value of the site so far has been in preparedness. Kentucky's magnitude 5.2 earthquake on April 18, 2008, brought home the value of good preparation through seismic exercises and planning workshops.
Beyond Emergency Response
The state known for coal mines, thoroughbred horses, bourbon distilleries, and bluegrass music was also one of the first to have an office dedicated to GIS. The data collected and maintained by the Commonwealth of Kentucky has proven useful not only for statewide emergency response but also for planning and decision making. As a data steward, the Kentucky Public Service Commission not only compiles GIS data but also uses that information in its daily business.
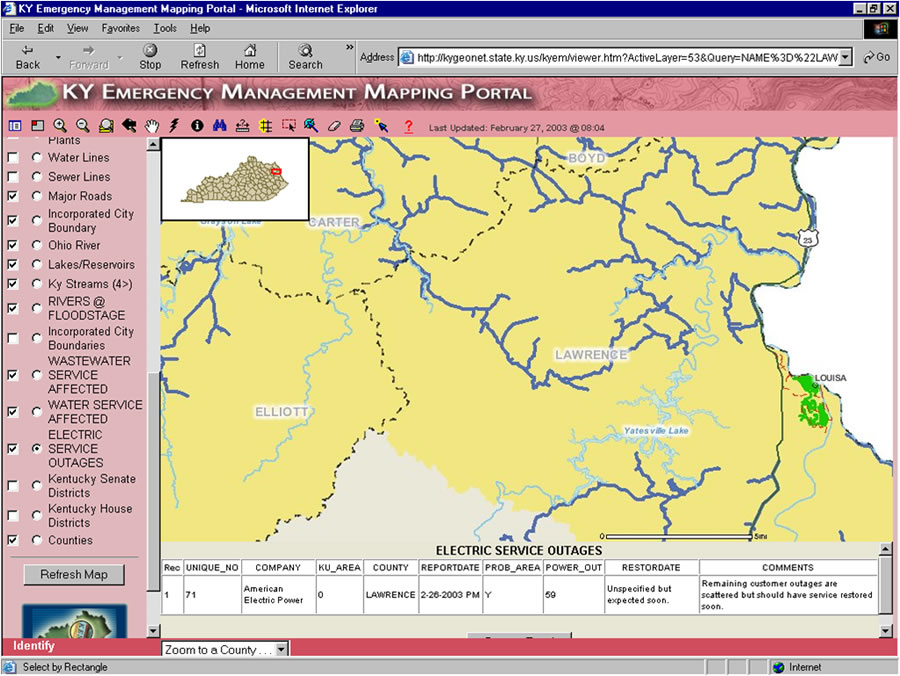 During Kentucky's 2003 ice storm the Division of Geographic Information used ArcIMS to create an emergency mapping application. The yellow defines areas of electric outages, superimposed by blue lines representing water pipes that were unable to deliver clean drinking water. |
"GIS offers policy makers and industry professionals comprehensive data that fosters well-informed decisions," said Rowles.
A current example is the repair of Wolf Creek Dam on Lake Cumberland in the southern part of the state. In February 2007, the Army Corps of Engineers lowered the water level to 680 feet and warned that the level may have to be lowered further to keep the dam stable. This was a cause for concern at the nearby Cooper Power Plant, which could not operate with a water level below 675 feet without considerable modifications. Although power could be purchased from outside sources, the transmission company would probably still be unable to meet peak demand. This would mean periodic outages in some of its service areas if the water level fell below 675 feet.
The commission used ArcGIS to make a map showing the location of the lake and dam, the power plants and transmission lines in the area, and the affected service areas in the event that the Cooper Power Plant could not generate electricity. This map was used to describe the problem to policy makers and emergency planners throughout state government.
When Rowles was first hired as GIS manager, she said the commissioners asked for a "map book" of the commonwealth's regulated utilities.
"Map books were difficult to maintain, since paper maps are easily outdated," Rowles said. "In addition, if the three commissioners had this information, then at least six other administrative staff wanted it as well."
The resolution came when Rowles implemented GIS as a method of conveying maps to everyone in the Public Service Commission. A link leading to an intranet Web site called Reference Maps was placed on every computer desktop. The site lists reference maps by industry (electric, gas, telecommunications, water, sewer), with hyperlinks to PDF files residing on a local server. Additional links take users to Kentucky ArcIMS sites maintained by the Infrastructure Authority and the commonwealth's Office of Technology's Division of Geographic Information.
Kentucky's electric service areas were established by statute in the early 1980s, with boundaries submitted on topographic maps signed by each party. That data, along with information from the Tennessee Valley Authority (TVA)-regulated distribution cooperatives and the municipal electric utilities, was compiled into a GIS layer for electric service areas. The data and statewide maps are available on the Kentucky Geography Network and on the commission Web site.
"We had a big push in 2002 to build power plants in Kentucky, and there was talk of increasing the megawatts by 50 percent," Rowles said. "With a downturn in the economy and uncertainty regarding energy regulation, many of these projects collapsed. We still built the power plant database along with a transmission line and substation database for the six major transmission utilities in the state."
Maps are now an essential tool for commissioners when ruling on proposals for siting new power plants and transmission lines.
"Information regarding impact on the transmission system of a proposed power plant was recently submitted with a list of transmission lines and substations that had to be built, replaced, or upgraded," Rowles explained.
With ArcGIS, Rowles was able to create a map showing the effect of the proposed power plant with the transmission lines and substation on utilities and transmission lines as far as 200 miles away. "On occasion, the location of a transmission line becomes contentious in a particular area, so I will make a detailed map illustrating the proposed route and features relevant to the siting dispute," Rowles said. "We now have developed our own set of criteria for transmission line siting, which includes avoiding equine activity, for example. The point of making these maps is to help the commissioners make informed decisions."