Supplying More Comprehensive Security at Bowl Events
By Jesse Theodore, Esri Writer
The world's biggest football game—attended by tens of thousands of fans and watched by millions around the globe—involves much more than three-plus hours of competition.
 The Risk Analysis Center software, combined with GIS, integrated different data types including aerial photos of the Raymond James Stadium in Tampa, Florida. |
For two weeks before the Super Bowl, the host city becomes a sports mecca. Dozens of pregame events occur in multiple locations, including TV shows, media events, National Football League (NFL)-hosted activities, fan celebrations, and parties. With all these high-profile gatherings underway, the community can become a target for all kinds of disruptive and destructive activities. Multiple law enforcement organizations and other government agencies must plan far in advance to provide the security that makes such a major sporting event a safe and enjoyable experience for fans.
To prepare for last February's Super Bowl, the City of Tampa, Florida, including the city's police department, spent years laying the groundwork for a security information system that would give officials up-to-the-minute situational awareness. Geographic information system (GIS) software played a winning role in that system.
The software was fully integrated with Esri business partner Digital Sandbox, Inc.'s Risk Analysis Center (RAC) software, a primary security information system that linked the Emergency Command Center and more than 10 command posts located throughout Tampa with real-time data and analysis about security threats.
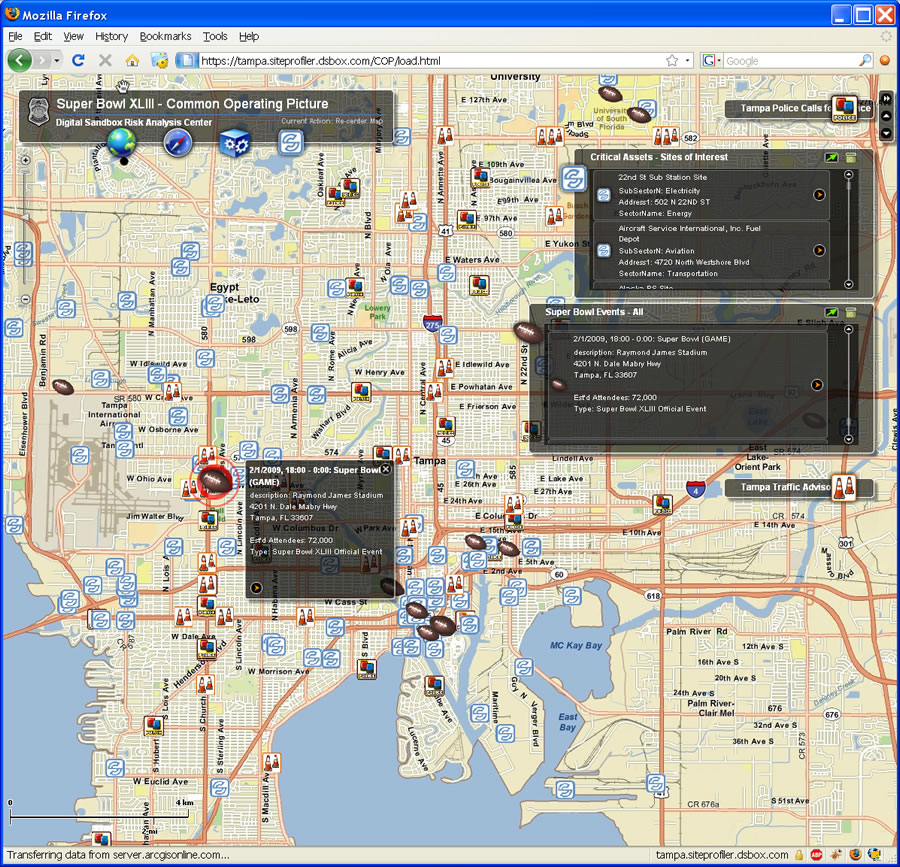
The two systems worked seamlessly to supply the Tampa Unified Incident Command staff, manned primarily by Tampa police, with a map-based common operating picture (COP) and enhanced situational awareness for monitoring events on the ground as they happened. What once involved many systems working independently became a seamless platform of intelligence and analytic tools.
"The ability to integrate GIS with our risk management solution supplied a unique situational awareness capability," said Anthony F. Beverina, president and cofounder, Digital Sandbox. "Instead of pockets of knowledge or separate information flows, there was one complete framework benefiting the many different agencies managing security. The speed of information capture and exchange was many times faster than what was previously available."
A GIS-Based Common Operating Picture
The Tampa Police Department coordinated Super Bowl security for a team that included personnel from more than 20 state and federal agencies; the NFL; and the game's competitors, the Pittsburgh Steelers and Arizona Cardinals.
"The key to managing security during a massive event is ensuring a collective understanding of our risks and coordinating the scores of agencies involved in mitigating these risks," said Major John Bennett of the Tampa Police Department, incident commander for Super Bowl XLIII. "We have been working with the Digital Sandbox team [members] for over five years to lay the foundation for this capability, and they were able to deploy a solution that met our needs exactly."
To pull off such a large coordinated effort with so many players, the Tampa Police Department and Digital Sandbox reviewed the RAC solution a year before the Super Bowl and mapped out a series of modifications.
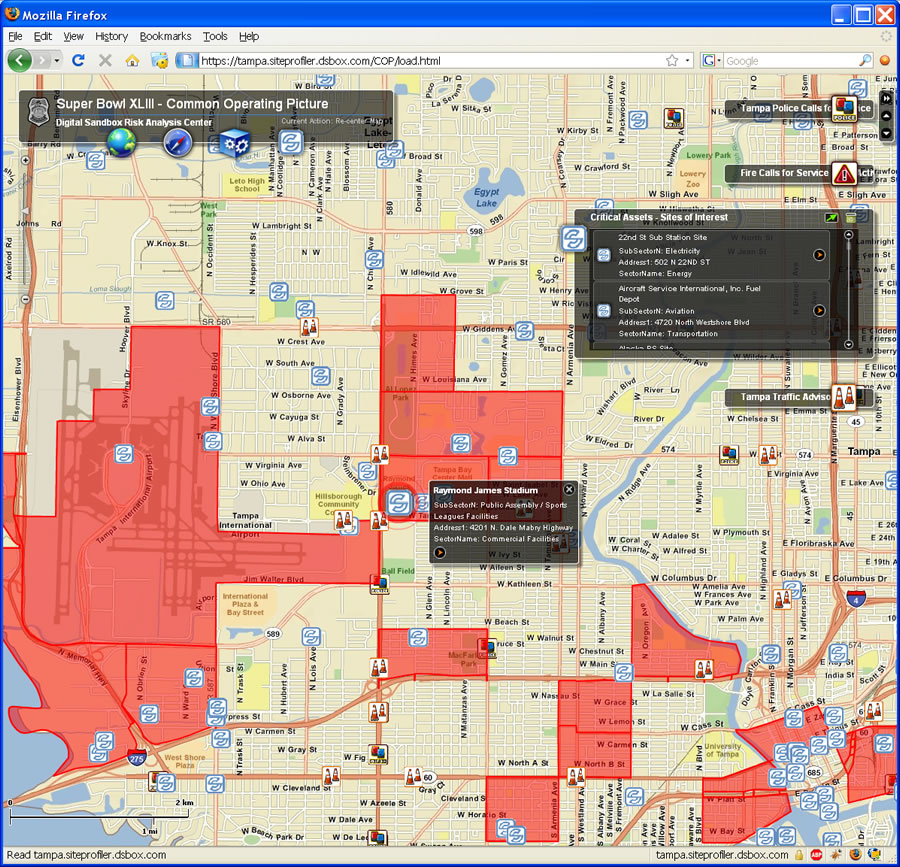
First, both organizations prioritized 119 of the more than 4,300 items in Tampa's critical infrastructure asset catalog that would receive additional review for accuracy and completeness. Next, they further scoped that list to identify 19 top-priority assets, including 17 key event venues, for enhanced threat and risk assessments.
 ArcGIS supplied a map-based interface for officials in charge of Super Bowl security. |
After the assessments were complete, Digital Sandbox produced a series of risk playbooks that supplied detailed information about potential risks and response capabilities for the events and venues. The risk playbooks contained more than 500 master timelines that showed the exact start and end times for all Super Bowl-related events during the three weeks leading up to the game.
More than 85 playbooks were distributed. Recipients included Tampa police, the mayor's office, NFL and team security officers, commanders in the fire and emergency services departments, and representatives of federal agencies that were coordinating security with Tampa police.
Digital Sandbox combined the information from the playbooks and RAC into the ArcGIS software-based COP. RAC is Digital Sandbox, Inc.'s combination of software modules, analytic models and experts, and applications that enables dynamic risk management of critical infrastructure assets, people, and events. Staff used ArcGIS Server software combined with Esri Situational Awareness, tightly integrated with RAC modules, to fuse operational data such as security checkpoint locations, event descriptions, staff movements, weather, and other sensor data with geospatial layers such as streets, buildings, and infrastructure.
Esri Situational Awareness supplies a complete and ready-to-operate hardware, software, and data package. It's specifically designed for national security, defense, and intelligence organizations. It uses a powerful data fusion and analysis engine based on core Esri server technology, a set of fully customizable, clients for data fusion and visualization, and locally hosted data. It also includes terabytes of prerendered U.S. and worldwide data.
The combination of Esri software combined with RAC Modules provided a real-time map view of events as they occurred. The software, with a Web-enabled browser and Web mapping services, also helped personnel within and throughout many organizations better collaborate and communicate. The staff at command posts throughout the Tampa area, as well as users working remotely in the field, linked into the system by simply logging on to a secure Internet Web browser. As new information, maps, aerial photography, or satellite imagery become available, it was automatically updated and accessible via the system. Personnel easily observed traffic, airspace, waterways, and crowds by using the map interface. Staff also monitored and investigated alerts, potential leads, and unusual or suspicious events as the information streamed into the COP via RSS or other live data feeds.
Police, fire, and emergency medical calls for service could be viewed in real time on the map, with related incident information available in a text-based dialog box. Locations of critical assets, points of interest, hospitals, fire stations, and traffic advisories were all available.
Police officers performing a vehicle stop would immediately log their incident data into their vehicle data terminals. The ArcGIS software-based COP would instantly consume that data and make it available to all command posts and devices accessing the system. Users could see the location of that incident on the digital map as well as read the details about the traffic stop. RAC also dynamically correlated nearby asset and risk information and flagged it on the ArcGIS display for optional drill-down.
This capability was available for all types of incidents. Security staff could see incidents throughout their areas of responsibility as they unfolded. They would instantly see where emergencies occurred and deploy the necessary resources and staff. They would monitor responders via the map interface and give and receive information in real time. Staff in the Tampa area also had open lines of communication to federal resources both locally and outside the state. If a large-scale incident had occurred, such as a terrorist strike, commanders could have instantly evaluated the incident using RAC applications directly from the COP and contacted state and federal government agencies for assistance.
How the System Worked
At 6 p.m. on game day, about 30 minutes before kickoff, a police officer reported a suspicious package near Raymond James Stadium, where the Steelers and Cardinals were about to play. The package was discovered near a power grid transformer. The immediate question back at the command center: What's the potential threat to the people and buildings in the immediate vicinity?
 Real-time data feeds and visualization capabilities helped officials monitor incidents as they unfolded. |
As law enforcement responded, analysts at the command center had the tools available through the integrated COP and RAC systems to monitor the incident and evaluate risks. Using the results from RAC's Blast Effects module, they could look at potential impacts of an explosion and what measures might be needed to respond to this situation. What previously would have been a purely reactive capability now was a dynamic, proactive response.
Analysts viewed near real-time incident data supplied to the COP. In responding to the call, law enforcement officers entered information about the incident into their mobile unit computers. The data was then instantly uploaded to computer-aided dispatch (CAD) and records management systems (RMS) that connected to the COP.
Analysts viewed the area where the suspicious package was reported, using an aerial image of the stadium with the location of the package digitally marked on the map. They began to look for other critical infrastructure or predefined high-value sites that were nearby. They also viewed a digitally maintained street map network to look at the potential traffic impact if the package were deemed dangerous. They quickly collected and relayed the list of nearby critical infrastructures to commanders. Had they needed it, RAC's Blast Effects Model was also available to allow analysis of the location to determine the possible blast radius.
Officers investigated the suspicious package and determined that it was not a danger. The people, workflows, and technologies in place aided in the officers' fast and comprehensive response.
In another real-world example, a report of a suspicious person/activity just outside the stadium was phoned in to Tampa police. An analyst began to conduct a search around that area using Critical Asset Locator, built using RAC and ArcGIS Server technology, to determine if there were any other high-priority assets nearby.
With just a couple of mouse clicks, RAC's Critical Infrastructure/Key Resources (CIKR) proximity search feature zoomed in on the area. The analyst immediately could see relevant CIKR ranked by priority: a nearby hospital, which was a priority 2 asset, and two priority 3 assets. The analyst quickly moved the cursor over the priority 2 critical infrastructure, and the information about the facility appeared on the GIS map. The suspicious person was reportedly within .2 mile of One Buccaneers Place, the training facility for the Cardinals and headquarters for the Tampa Bay Buccaneers. The analyst then pulled up the facility's venue and contact information from RAC for Tampa police.
Asset links were configured to automatically bring up the related RAC application page with a complete set of security information, including contact details.
If the suspicious person had fled the scene, the analyst could have used the integrated Service Area tool, a GIS-enabled RAC application, to determine how far the suspicious person could drive in one minute, three minutes, and five minutes. Digitally mapped results with color-coded polygons would show how far the suspect could get within the given time frames. The report turned out to be unfounded. But the automation available through the COP minimized the distraction, allowing personnel to stay focused on their missions and validated threats.
Smooth Information Flow
For commanders monitoring Super Bowl-related events, GIS helped keep information flowing smoothly from the field to the command posts and back again, as well as between multiple information systems and data feeds. All the map layers, aerial photography, and incident information were available 24/7, on demand, to staff via secure Internet connections in the command center and command posts.
The system kept agencies on the same information page as dozens of incidents unfolded during the Super Bowl. For every incident, GIS and the COP helped with the security and law enforcement activities.
"For years now, we've had all kinds of systems and data to draw on but no central hub or set of disciplined processes to make sense of it. Digital Sandbox pulled it all together and simplified it through the GIS interface, giving us just the right information we needed when we needed it, in a context that allowed us to do our jobs better," said Bennett from the Tampa Police Department.
For more information about the project, contact John Ticer, vice president of marketing for Digital Sandbox, Inc., at jticer@dsbox.com.