Esri's 2009/2014 Updated Demographics Provides Answers
Almost everyone feels the impact of the current recession. Americans who haven't lost a home or a job are, in many cases, experiencing low or no income growth. They are seeing the value of their houses, savings accounts, and retirement funds decreasing. Credit costs them more. Their hard-strapped state and local governments are cutting back on services. Some businesses in their communities are shuttering due to the downturn.
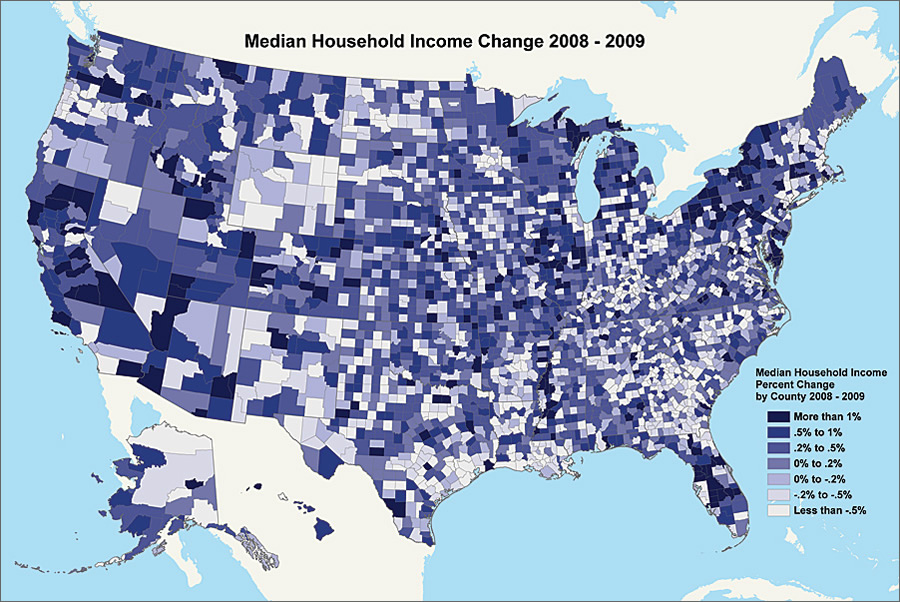 This map of the United States by county illustrates the percentage of change in median household income from 2008 to 2009. Areas that show the greatest change include parts of Michigan, Pennsylvania, Illinois, California, North and South Carolina, and New England. This can, in many cases, be attributed to job losses and unemployment. |
What does this current economic climate mean for businesses, government agencies, and organizations? How can they find information about income and other demographics that will help them make better-informed business or public policy decisions?
Esri Data-Updated Demographics provides income information such as median household income, net worth, and disposable income, along with more than 2,000 other demographic data variables in a variety of ranges, geographies, and formats. Esri's Updated Demographics data is carefully developed by proven methodologies to provide the highest possible level of accuracy and is available in Esri products including ArcGIS Business Analyst Online, ArcGIS Business Analyst (desktop), Business Analyst Server, ArcGIS Online, and Address Coder and as ad hoc data variables.
Agencies, businesses, and organizations depend on income data variables to perform accurate revenue analyses with actionable results. For example, agencies can use the data to determine affluence by population, age, race, and other demographic variables; analyze low-income areas to reveal needs for services; and study potential for revenue generation. Businesses can analyze spending patterns by demographic variables such as age, income, housing, race, or education. Organizations can discover new fund-raising opportunities or assess areas that require additional services.
What are some of the latest economic trends worth noting?
Consumers are cutting back on discretionary spending and saving their money. Many people have stopped spending for anything other than necessities. Others are shopping more carefully, using coupons and other promotions and looking for product durability instead of succumbing to fads. "Conspicuous consumption" is now out of favor with consumers who seek better value for their dollar. Others have jumped on the savings bandwagon and are putting their money away instead of spending frivolously.
Reduced sales also means less profitability for retailers, who are revamping their strategies by offering lower prices, more promotions, and deeper discounts and changing their merchandise and marketing to attract different consumer segments. A retail sector that is growing during this recession is the discount store. Several companies that feature no-frills low prices are expanding into new markets and altering their store displays to attract more affluent consumers who are new to bargain shopping.
Lower consumer sales generate less sales tax revenue at a time when more people need more services. Governments are making tough budget cuts-raising taxes and fees just when more people are unemployed, cutting their spending, and struggling to make ends meet. Nonprofit organizations are raising fewer dollars as demand for services has increased. Donors at all levels of affluence are reluctantly cutting back on contributions, forcing nonprofits to develop innovative marketing campaigns and search for other donation sources.
Here are some facts and figures about income in the United States from the Esri Trends Analysis: 2009/2014 white paper, written by Lynn Wombold, Esri's chief demographer and manager of the data development team.
- Median household income for the 2008 calendar year was $54,700, an increase of 2.9 percent annually since 2000 but down by 0.1 percent from 2007.
- Average household income declined from $73,800 to $71,400.
- Per capita income declined more than 3 percent to $27,300.
- Between 2008 and 2009, the U.S. median net worth fell by 7.6 percent to $97,700.
- Average net worth dropped by 11.7 percent to just below $449,000.
- Median disposable income is $43,400 in 2009; the average disposable income declined 1.4 percent to $57,400.
However, all is not "doom and gloom." A few areas have experienced some income growth, although not at the previous rates of appreciation. Douglas County, Colorado, continues to rank first in median household income in the country. Maintaining annual median household incomes of more than $100,000 were Loudoun and Fairfax counties and Falls Church City in Virginia; Hunterdon, Somerset, and Morris counties in New Jersey; Los Alamos County in New Mexico; Nassau and Putnam counties in New York; Howard County in Maryland; and Santa Clara County in California. Areas where income has dropped include parts of Michigan, Oregon, and North and South Carolina, where unemployment is high and layoffs have occurred.
Information about income in the United States was excerpted from the Esri Trends Analysis: 2009/2014 white paper, written by Lynn Wombold, Esri's chief demographer and manager of the data development team. Learn more about Esri Data-Updated Demographics.