ArcWatch: GIS News, Views, and Insights
July 2012
And the Study Says, "Esri Demographic Data Most Accurate"
Esri was recently ranked number one for data accuracy in an independent blind study. The Vendor Accuracy Study compared total population and households data from Esri and four other major demographic data vendors to the Census 2010 results.
The study found that Esri's Updated Demographics data variables were the most accurate across all geographies in the United States, especially at the census tract and block group geography levels, which are especially difficult to forecast. "Esri had the lowest score in population, household, and overall error," said the authors of the study in their final report. (Lower scores indicate higher accuracy rates.)

Scorecards were developed to summarize each vendor's relative performance. Lower scores reflect the most precise data, meaning the highest accuracy.
Built on Census 2010 data and in 2010 geography, Esri's Updated Demographics data contains current-year estimates and five-year projections for categories such as population, households, income, and housing. Esri provides the data in standard census geographies such as states, counties, census tracts, and block groups and user-defined areas such as rings, drive times, and hand-drawn areas to enable even more precise analysis.
Study Commissioned by Esri
The decennial census, conducted every 10 years, gives data vendors the opportunity to evaluate the accuracy of their annual demographic estimates by conducting a benchmark study comparing the data forecasts to census results. Data vendors also can learn how their estimates compare to those of other providers.
In 2011, following the 2010 Census, Esri commissioned an independent study to obtain an unbiased answer about its data accuracy. Esri sponsored the study to identify areas where its methodologies could be improved and ensure that Esri provides the most accurate demographic data to its users.
"Because an analysis of this magnitude—especially at the census tract and block group geography levels—has never before been undertaken, the research provides groundbreaking insight into error analysis and the testing of error measurement," said Lynn Wombold, Esri's chief demographer.
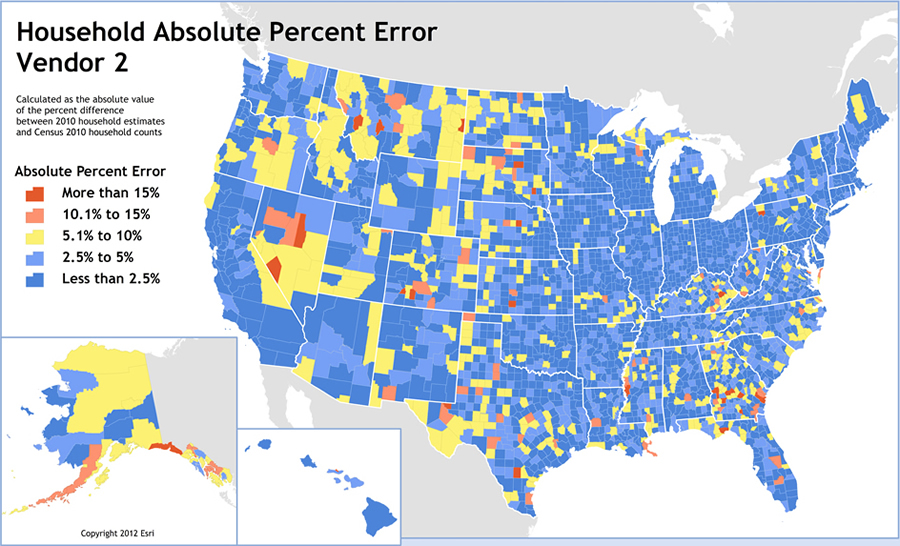
This map was created using Esri data for the US by county. The ranges in the legend show the percent difference between Esri's 2010 household estimates and Census 2010 household counts. The blue areas show the lowest absolute percent error.
Why are Esri's demographic data estimates and projections so accurate? According to Wombold, Esri's data development team continually improves the accuracy of demographic data updates by ground-truthing housing data at the block group level; by including non-traditional data such as residential construction data; and by developing techniques such as a methodology used for measuring population change by block group.
The Vendor Accuracy Study was conducted by Matthew Cropper, GISP, of Cropper GIS; Jerome N. McKibben, PhD, McKibben Demographic Research; David A. Swanson, PhD, University of California, Riverside; and Jeff Tayman, PhD, University of California, San Diego. The research team included geographers and demographers who are noted authorities on small-area forecasts and measures of forecast accuracy.
Data from each of the individual vendors was provided to the research team and identified only by number, enabling a completely blind study. The researchers had no idea which vendor's data was included or the methodologies used by the respective vendors.
Why Accurate Demographic Data Is Important
Many people assume that all demographic data is the same because all data providers use census data as the foundation to build their demographic data offerings. Differences in demographic data accuracy can occur with the addition of data from other sources and the methodologies developed by each data vendor. However, demographic estimates and forecasts can vary significantly from vendor to vendor.
Data inaccuracies may occur by either over- or underestimating populations or the number of households, with dramatic consequences for agencies and businesses, which analyze demographic data for a variety of reasons, such as designating areas that need additional social or health care services, deciding where to open new stores, or identifying residential areas that are at high risk for fires.
Health care providers that use faulty data could underestimate populations and miss vaccinating vulnerable people or waste doses by overestimating numbers. Retailers that locate a new store based on overestimated population data risk losing significant revenue. Local government officials who calculate area populations with poor data might lose grant funds. Public safety agencies could overlook people who have special needs before, during, and after a disaster. Does data accuracy matter? Yes, it does—in terms of dollars, health, grants, and services—and, in some cases, even life itself.
Esri's Updated Demographics data is available as a database in a variety of formats including shapefile, file geodatabase, and Microsoft Excel. Updated Demographics data is also available in Esri Business Analyst Online, Community Analyst, Business Analyst Desktop, Business Analyst Server, the Business Analyst Online APIs, and the Community Analyst APIs.
Read an excerpt from the Vendor Accuracy Study. Learn more about Updated Demographics.