Ozark Mountains' Red Oak Borer Beetle Scrutinized with GIS
By Barbara Shields, Esri writer
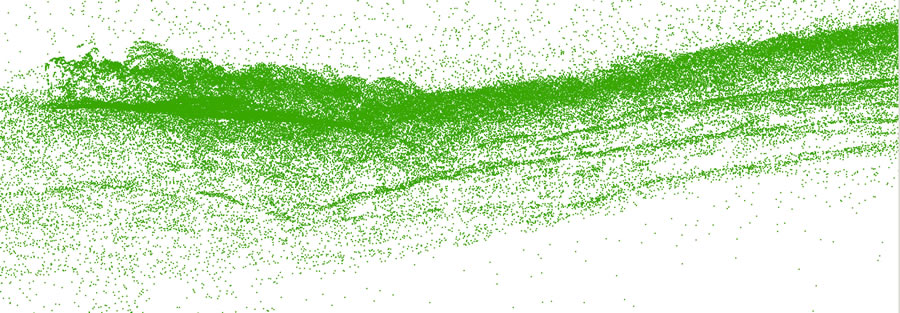 Figure 1: This 3D point cloud represents returned lidar points. |
Determining forest health is not easy. You cannot fit a tree into a CAT scan machine, nor can you hook it up to an electrocardiograph to assess its condition, but other scientific methods are arising to analyze forest fitness. A tree's wellness indicators include foliage, color, wood tissue, insect or disease infestation history, and water stress. Primary influences that impact wellness are location, soil nutrients, and water availability, all of which are attributes that can be re-created on a map and correlated with wellness indicators. University of Arkansas researchers are gathering mega amounts of forest data and using geographic information systems (GIS) as a stethoscope to diagnose the health of local woodlands and map out treatment options.
A recent threat to the health of the Ozark Mountains' oak population is a long-horned beetle commonly known as the red oak borer. Indigenous to eastern North America, this pest has evolved as part of forested ecosystems, but it recently has threatened to wreak havoc on the region's forestry industry. These large beetles have a two-year life span that is oddly synchronous, meaning that they emerge in odd-numbered years and will celebrate their new generations in 2009, 2011, and 2013. This is unfortunate for the trees.
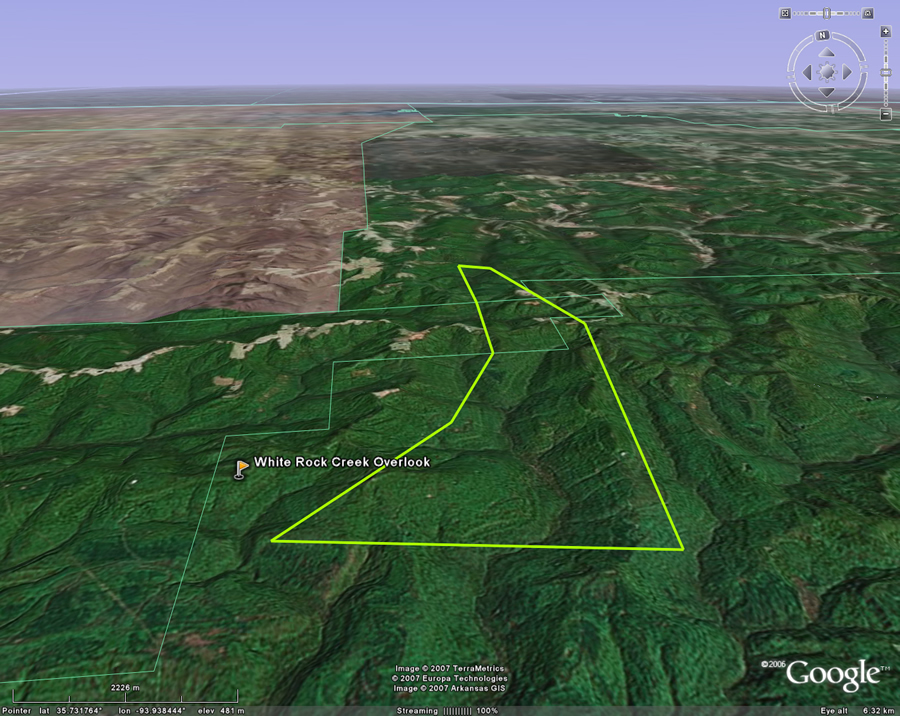 Figure 2: A lidar study footprint was generated in ArcGIS and exported to Google Earth. |
When red oak borer eggs hatch in the fall, the beetle larvae drill directly into the trunk and begin to feed on the phloem tissue of the tree, which is where a lot of the tree's nutrients are stored. The beetles become dormant in the winter, but in the spring they revitalize their hearty appetites and bore deeper into the heartwood of the tree. Each beetle creates a gallery that can be up to 50 centimeters long. Again the insect spends the next winter tucked away in its gallery to emerge in that odd-numbered year to reproduce and commence another hungry circle of life. In 1999, U.S. Department of Agriculture (USDA) Forest Service (USFS) pest management specialists noted scores of dead trees in the Ozark Mountains and assessed that the forest's decline was connected with the beetle. The affected area was 400,000 hectares including regions of Missouri, Arkansas, and Oklahoma. Entomologists, geoscientists, and USFS scientists formed a comprehensive team and collaborated to create an assessment tool. Financial support was provided by the USFS Southern Research Station through an applied silvicultural assessment headed by Jim Guldin of Hot Springs, Arkansas; and by the USFS Forest Health Protection Special Technology Development Program in collaboration with Jim Smith of Pineville, Louisiana. The University of Arkansas research team, with its Forest Service partners, designed the assessment project. The team collected and accessed a wide range of data to be scrutinized and, ultimately, visualized with Esri's GIS software. GIS is used to create thematic maps that illustrate patterns that a researcher looking at data tables might not be able to easily identify.
The operative word for GIS is database. At its most rudimentary level, GIS accesses data from the database, processes the data, and creates a map. Various types of geographic datasets can be used to create geographic data layers for revealing relationships. The forestry research team stored its field data using relational database technology, which is a data structure that logically associates different collections of tables by shared fields. This makes the datasets easy to join together.
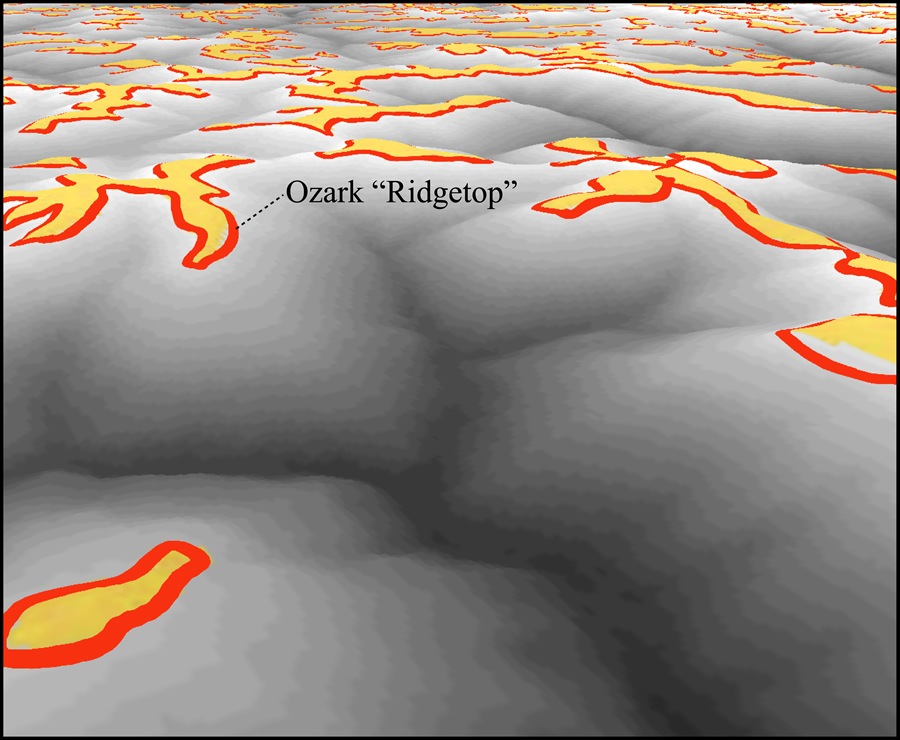 Figure 3: An Ozark ridgetop map indicates location, slope, light, and other variables that harbor red oak borer habitat. |
On the ground, data collection began with samples taken from individual trees and at the stand level. Tree data was categorized according to species, severity of stress, size classes, age, volume measurements based on a tree's diameter, beetle emergence holes, and so forth. Infestation within trees was defined and classified as high, medium, and low. The team developed a rapid-estimation procedure to help foresters, using some simple measurements, calculate the level of damage within these classes. GPS coordinates were collected for each tree location so that GIS queries could efficiently access the field data collected and show it by exact location.
From the air, data was gathered using aerial photography and light detection and ranging (lidar) imagery. Lidar is an optical remote-sensing technology that measures properties of scattered light to find range and/or other information about a target, emitting up to 50,000 laser pulses per second that are reflected back to the aircraft, where they are recorded. Lidar scans were made of the Ozark tree canopy in a 32 km2 area, and the resulting data was incorporated into a relational database. In situ data at individual tree and stand scales, along with ancillary (digital elevation models, vector layers, etc.) and remote sensor data, was input into GIS, which in turn calculated relevant spatial statistics. Researchers hope that this will eventually lead to the development of a hazard model capable of predicting future outbreaks.
The GIS-generated lidar image output is a 3D point cloud that represents the vegetation, structures, and ground (figure 1). This type of lidar application is relatively new because lidar was first used to study the terrain beneath vegetation. Esri's ArcGIS 3D Analyst is useful for this part of the study because it translates topographic data into geospatial representations. The team used ArcGIS 3D Analyst to represent the complex nature of the terrain and vegetation to identify patterns in the forest data. From the database, GIS created shaded relief, contours, angle of slope, aspect, hillshade, and curvature, giving a 3D appearance to a 2D map (figure 2). To focus solely on forest foliage, the Arkansas researchers subtracted the terrain return to get the actual model of the tree canopy. The next step will be to use GIS to develop regression models that will allow researchers to predict individual or stand conditions of trees on the ground from the lidar datasets.
Recent innovations in GIS have expanded to performing quantitative calculations and displaying the outcome quantitatively and geographically. By using allometric biomass equations and factoring in height metrics revealed by lidar, researchers base their calculations on the remote sensor data about the canopy to determine individual tree biomass and estimate the diameter at breast height (DBH) of a tree. GIS capabilities enrich and condense the resulting datasets as the users create ridgetop buffers and other ancillary data layers and apply suitability modeling rules for assessment.
The project is massive because it requires that 70 million lidar points be stored in the database and then be processed with GIS. This lidar point data is delivered in the American Society for Photogrammetry and Remote Sensing (LAS standard) format. But because the university is not equipped to work directly with the data in LAS format, data management experts from the University of Arkansas Center for Advanced Spatial Technologies (CAST) created an integration program. Using the workaround, they loaded all 70 million points and their respective attributes into an Esri file geodatabase. The next challenge was to maximize processing efficiency and decrease the vast amount of processing (CPU) cycles needed to do calculations on such a large database.
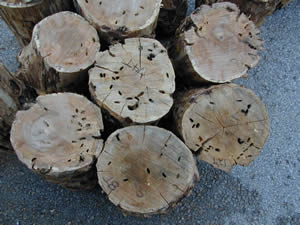 Cross-sectional gallery holes in red oak logs. This type of damage is typical of older, larger larvae nearing the time of adult emergence (near the end of its two-year life cycle). |
With approximately 100 megabytes of field data and notes, as well as field photos, ancillary GIS data layers, and several types of remote sensor data, the database for the project is extensive. The forestry team is using this data to create spatial statistics and visualizations for comparing patterns that reveal different stand and site conditions. This will help the team draw conclusions about why red oak borer populations increase and decrease.
Spatial analysis reveals that oak decline in relationship to the prevalence of the beetle is occurring on south- and west-facing slopes. These areas have higher solar insulation, and the soil is rocky and dry. One possibility is that at-risk trees in these areas have higher moisture stress, which could affect resistance to infestation. Researchers have acquired lidar data for only one year, so temporal comparison must include aerial imagery from 1999 to 2007. Because this imagery was originally captured for property boundary purposes, the forest images are ancillary, so season-to-season comparison is difficult. Another data capture resource is a hand-held spectral radiometer used on the ground to compile data for developing a baseline to see if there are differences in oak tree reflectance based on their levels of relative health. This sensing tool provides more controlled data without the intervening atmospheric distortion that occurs with an aircraft or satellite platform.
Preparing lidar data and calculating statistics is computationally intensive and slow, so the team sought a means to speed up the process and find ways to leverage the university's GIS software in a high throughput computing environment. To do so, the team used ModelBuilder (an application included with ArcGIS Desktop for designing specific geoprocesses) to create a series of routines using Python. Each routine is sent out to an available resource on the computing grid, which is a pool of available computers on the university campus. Each computer running GIS is dedicated to a little piece of the math and only a small section of the forest data. The program computes statistics on just a portion, then returns its results to be combined on one computer. This method allows the team to scale-up GIS data processing capabilities. The lidar statistics and other GIS models, such as ridgetops, are helping the team predict areas that will be most vulnerable to high populations of red oak borer (figure 3).
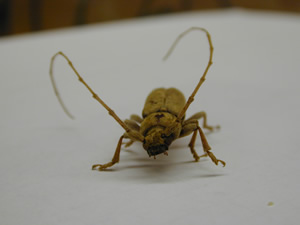 This is a mature red oak borer. |
The follow-up question the team seeks to answer is this: What kind of forest management techniques can be used to promote healthy forests and avoid infestation problems in the future? To determine the answer, the team is designing area-wide hazard models that landowners and Forest Service personnel can use to predict the level of risk that forests have of being infested and determine how to modify management strategies that will reduce red oak borer attack.
The challenge is to use the best combinations of the different datasets to gain a geographic understanding of the forest's transitions. The team's ability to create these combinations depends on continued funding. If the program is funded, the team hopes that it will be able to create hazard models and interactive digital maps including thematic layers, still photos, and virtual reality movies that show 180 degrees around the condition of a specific canopy. The goal is to get the project's data and findings into the hands of the public including people who do not have GIS software. To do so, the team is considering online services such as ArcGIS Explorer and Google Earth as a means of publishing geographic information, research data, photographs of tree stands, infestation stress, and more.
Based on the diagnosis formulated in GIS and treatment prescribed on a map, foresters can work to alter conditions that would otherwise lead to tree mortality. Intelligent geospatial analysis enables managers to respond by thinning overly dense stands, changing species composition, or removing those trees susceptible to red oak borer infestation.
Thanks to John Riggins and Fred Stephen of the University of Arkansas Department of Entomology and Jason Tullis of the University of Arkansas Center for Advanced Spatial Technologies for their work on the research team and for providing information for this article.