ArcWatch: Your e-Magazine for GIS News, Views, and Insights
August 2011
Fans Follow Race in Australia Using Yacht-Tracking Map
Esri Australia's Online Mapping App Attracts 35,000 Visitors
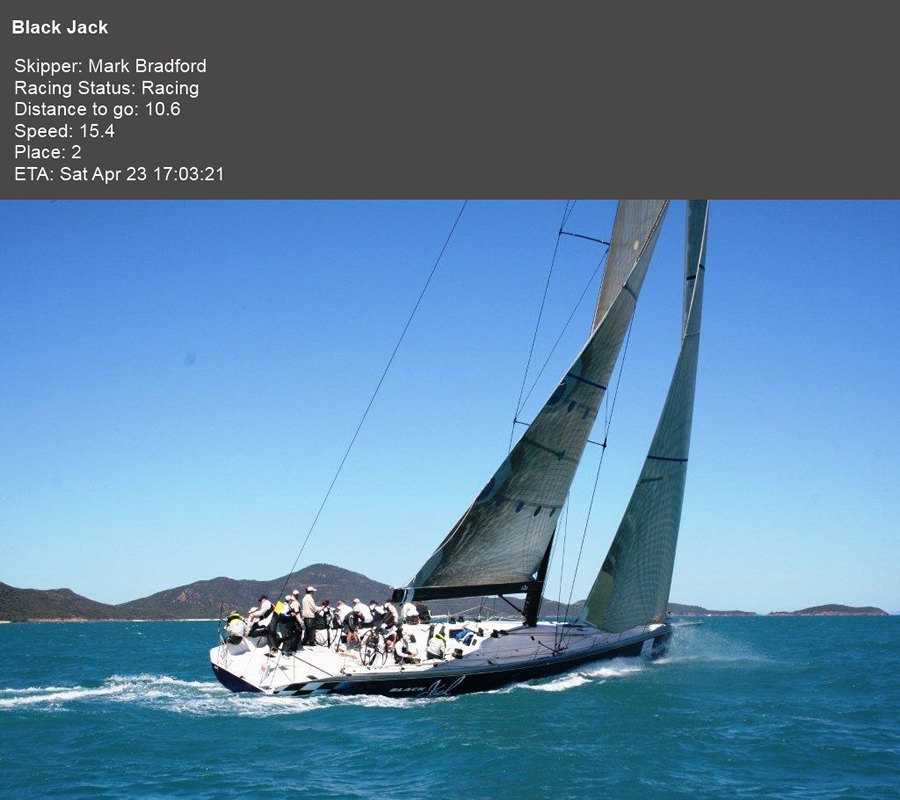
Yacht Tracker provided information about each race participant.
After watching the 45 yachts in the Australia's QantasLink Brisbane to Gladstone Yacht Race slip out of Moreton Bay and into the open sea, many of the 60,000 fans continued to keep track of the race on their computers and smartphones. Using an online mapping application called Yacht Tracker, they followed Black Jack, Lahana, and the other competitors as they raced north over the next two and a half days.
The Yacht Tracker application, built by Esri Australia Pty.Ltd., provided near real-time updates of the yachts' positions as the race progressed north along the 308 nautical mile course that followed Australia's eastern coastline. The mapping app allowed users to see detailed information about individual boats and their crews, including a photo of the yacht, the skipper's name, distance to go, speed, and estimated time of arrival. More than 35,000 fans visited the Yacht Tracker app during the race. At several points, the application was handling more than 400 map requests per second.
Esri Australia configured two applications, one for web browsers, built on ArcGIS API for Flex, and another for mobile devices, built on ArcGIS API for JavaScript.
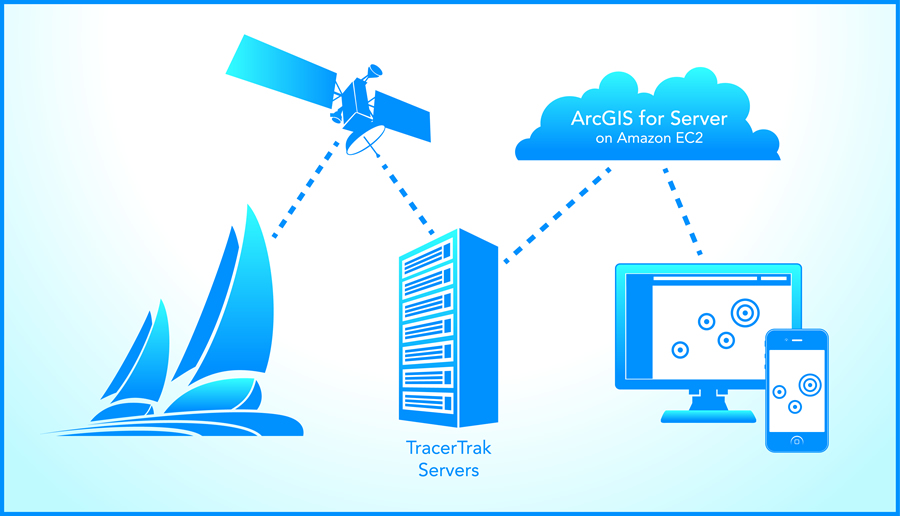
Behind the scenes, Yacht Tracker used data gathered from an interlinked system of GPS and cloud GIS. TracerTrak hardware, a real-time tracking solution owned and operated by Pivotel, was placed on board each of the yachts. The locations of the yachts were transmitted via a satellite network back to the TracerTrak servers. Those dynamic locations were conveyed to an enterprise geodatabase instance and an associated cluster of ArcGIS for Server instances located on the Amazon Elastic Compute Cloud (EC2). The GIS servers, in turn, delivered the locations via web services to the Yacht Tracker web and mobile applications.
By using Amazon's cloud infrastructure, the applications could easily and automatically scale up to accommodate peak loads on the servers and scale back down as demand subsided.
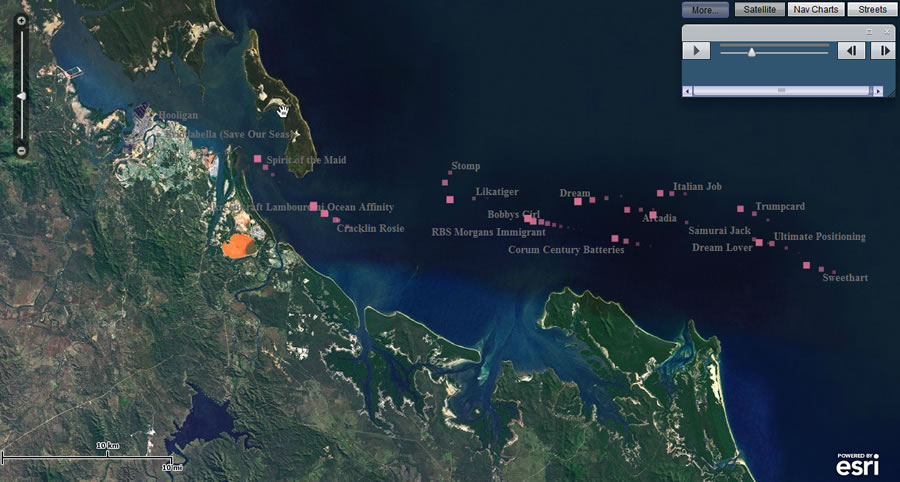
With the playback tool, the time-series data for the race can be replayed using only a subset of yachts.
Once the race ended, Esri Australia modified Yacht Tracker to allow visitors to replay the race at their convenience. Using a simple playback tool, people can watch the race as many times as they like while panning along the course and zooming in for a closer look at various groups of yachts. Playback also allows the user to select a subset of yachts rather than watch the entire field of contestants.
"This is the eighth year that Esri Australia has provided an online map for the QantasLink Brisbane to Gladstone Yacht Race," says Ben Somerville, industry solution architect, Esri Australia. "It is the fourth year we've used the TracerTrak devices and the first year we've used cloud GIS to help handle yacht racing fans' growing awareness of the mapping application," Somerville says. "It just keeps getting better every year."