National Bridge Inventory Shows Structures at Risk
Esri's ArcGIS Software Helps Analyze Bridge Data and Assess Risk
By Barbara Shields, Esri Writer
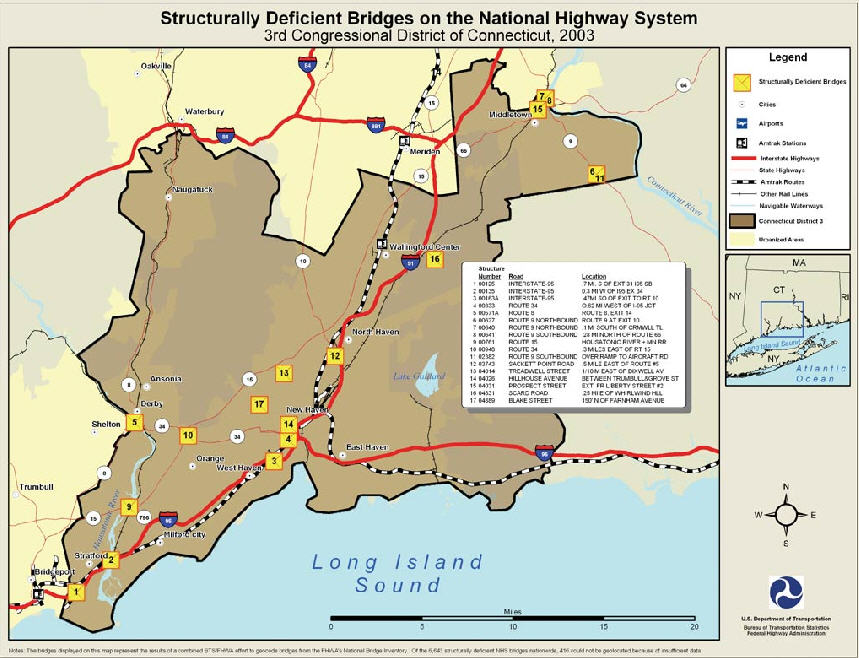 The National Bridge Inventory has been geocoded, with on-demand GIS maps distributed to Congress. |
The collapse of the 1,907-foot steel truss bridge that spanned the Mississippi River in Minneapolis leaves many people wondering about the safety of the bridges they cross on their daily commutes. Was the August 1, 2007, accident, which killed at least 13 people, a wake-up call?
With more than a half-million bridges in the United States, is it possible that similar structures could succumb to the same fate as the Interstate 35W bridge? The bridge collapse certainly made communities across the country wonder which bridges in their areas have a high risk of failure.
The National Bridge Inventory, compiled by the U.S. Department of Transportation's Federal Highway Administration (FHWA), offers a vast data system that helps communities understand the strength of their local bridges. This huge bridge inventory has been geocoded, with on-demand GIS maps distributed to Congress.
This valuable information about bridge type, traffic load, age, levels of deterioration, and ownership helps members of Congress and local government officials better understand the quality of bridges in states, districts, cities, and towns.
Mapping the Bridge Data Using ArcGIS
The FHWA, which keeps tabs on the nation's bridges, reported information about 596,842 bridges in 2006. The National Bridge Inventory matches bridges and their locations to an attribute database that includes specifications for load and resistance factors, seismic design, and supporting elements such as ultra-high strengths of concrete or steel.
The data is input into Esri's ArcGIS software to produce maps, which are made available to certain government agencies including Congress. The public can access bridge inventory data on the Federal Highway Administration's Web site. The data can be used in its raw form for tables or within a GIS for geospatial display and analysis.
The Bureau of Transportation Statistics, a U.S. Department of Transportation Research and Innovative Technology Administration agency that manages the National Bridge Inventory, worked with geospatial technology consultants and the FHWA in 2003 to geocode the bridge data.
The results of the map-based inventory provide a resource for relationship analysis. With this information, an analyst might import the data into a project to determine corrosion factors such as the effects of salt on bridges in a coastal community. Freeway overpasses' seismic design could be coded and shown in proximity to areas with high earthquake activity.
Tens of Thousands of Bridges Structurally Deficient
In 2006, the National Bridge Inventory reported that 73,764 of the nation's bridges were structurally deficient. The department's criteria for a structurally deficient bridge is "significant load-carrying elements are found to be in poor or worse condition due to deterioration and/or damage, or the adequacy of the waterway opening provided by the bridge is determined to be extremely insufficient to the point of causing intolerable traffic interruptions."
Transportation authorities can follow up on a bridge that the department has classified "deficient" with a hands-on inspection to determine the safety of the bridge and whether or not it should be restricted to weight limits or completely closed.
Bridge inspectors rate bridge conditions by evaluating the severity of deterioration or disrepair and the extent to which it has spread through the component being rated. The bridge conditions are rated from 9 for excellent to 0 for failed. A good rating (7) indicates no problem; a fair rating (5) indicates that all primary structural elements are sound but may have minor section loss, cracking, spalling (surface area where flakes of material are broken off), or scour (loss of material due to stream flow); a poor rating (4) indicates advanced section loss, deterioration, spalling, or scour; a failed rating (0) indicates that the bridge is out of service and beyond corrective action. The classifications are not mutually exclusive, and an individual structure may have one or more deficient components.
Call to Inspect Steel Deck Truss Bridges
The National Bridge Inventory (NBI) for bridge I-35W (NBI structure number 9340) indicated that the deck condition of the Minneapolis bridge was in fair condition. The deck is the surface used for transportation. The bridge's superstructure condition received a poor rating. Superstructure includes an assessment of transfers from the load of the deck and the traffic carried to the supports. Within the superstructure are the girders, stringers, and other structural elements.
Combining structural assessments with condition ratings determines whether a bridge should be classified as structurally deficient. In 2004, the Bridge Inventory System gave I-35W a sufficiency rating of 50 percent, which is neither extremely bad nor good. Perhaps the statistical flagging was not red enough. U.S. Department of Transportation secretary Mary Peters notes, "Obviously something happened here that none of us expected." Still, statistics cannot be ignored with 12 percent of the nation's bridges being classified as structurally deficient. Peters called on all states to immediately inspect any steel deck truss bridges similar to I-35W. Most bridges in the United States have similar structural data included in their inventory listings and condition ratings.
Communities such as Allston Brighton, Massachusetts, are posting National Bridge Inventory data about local bridges on their Web sites (visit the Allston Brighton Community blog). These sites give the public an opportunity to respond. If a bridge is listed as functionally obsolete, the commuter might want to reconsider their route to work. Communities can use the information to identify bridges in need of repair and take action by planning safety enhancements.
Following the Minneapolis bridge collapse, the U.S. House of Representatives' Transportation and Infrastructure Committee requested an update to the 2003 maps the FHWA produced. FHWA recently okayed the public release of the geocoded data.
The geocoded data is available at National Transportation Atlas Database.
For more information about the nation's bridges, visit the U.S. Department of Transportation Federal Highway Administration National Bridge Inventory Web site.