Agribusiness Grows with Crop-Specific Maps
By Jessica Wyland, Esri writer
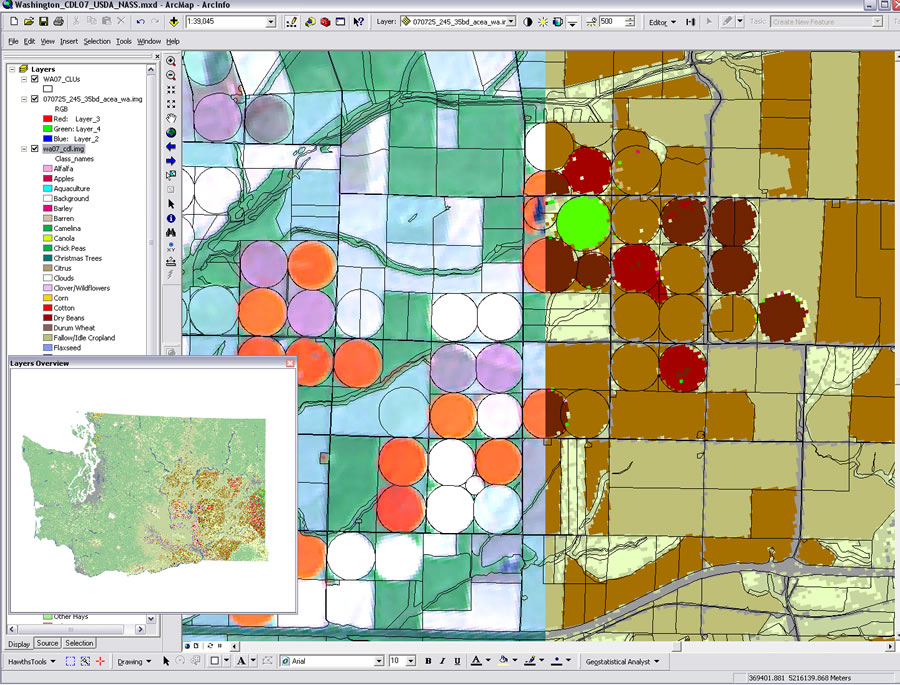
 The state of Washington is shown in the NASS 2007 Cropland Data Layer with USDA/Farm Service Agency with Common Land Unit data overlay. |
Crop-specific maps, created by combining survey data and satellite images, provide a literal lay of the land for farmers and agribusinesses such as seed and fertilizer companies. Corn, soybean, rice, and cotton crops grown in the Corn Belt and Mississippi River Delta areas of the United States are mapped extensively in the Cropland Data Layer (CDL) now available for download or on DVD from the United States Department of Agriculture/National Agricultural Statistics Service (USDA/NASS).
Geographic information system (GIS) software from Esri is used to prepare and manage agricultural data and build geospatial snapshots of cropland.
"There are many possible uses for the Cropland Data Layer inside and outside the farming community," said Rick Mueller, a GIS expert with NASS. "CDL can be leveraged in a GIS to perform spatial queries against other enterprise GIS data layers. It can be extracted and masked out so public or private entities can focus solely on their own interests."
Enhancing a GIS with land-cover data layers has proved helpful to crop growers' associations, crop insurance companies, seed and fertilizer companies, farm chemical companies, libraries, universities, federal and state governments, and value-added remote-sensing/GIS companies. Agribusinesses refer to the data to site new facilities for retail supplies and equipment, route transportation of crops and goods, and forecast harvests and sales. A fertilizer company, for example, can use CDL to better anticipate how much fertilizer will be needed in specific regions. The data is also used by pesticide companies to study pest migration trends and pesticide applications. It is used by farmers and conservationists to perform risk assessment of wildlife habitat, crop stress, and blight locations. Educators determine research locations based on crop density distribution and develop ecosystem models with CDL figures and images.
 A combination of the Washington 2007 Cropland Data Layer with raw AWiFS data taken on July 25, 2007, shown with Common Land Unit overlay using the swipe function. The band combination displayed is 3,4,2. |
For each state in the Corn Belt and Mississippi River Delta areas, CDL provides the categorized raster data along with accuracy statistics and metadata by state. CDL is a unique product that provides annual updates of the agricultural landscape. The entire inventory of CDL products is available for download from the Geospatial Data Gateway.
"ArcGIS Desktop [software] from Esri makes it possible for us to create resourceful maps to identify the spatial extent and associated acreage of the crops grown in these specific states," said Mueller.
Esri's ArcMap application is also used to create finished products—detailed, informative maps of U.S. cropland for agricultural stakeholders. GIS specialists use ArcMap to create maps that are distributed to NASS field offices, where they are used at trade shows and distributed to customers. ArcMap is also used to create the CDL Web Atlas, where each county within a state is plotted with the location of acreage planted with corn, oats, winter wheat, peas, and other crops and encapsulated in a single PDF file. The increasing functionality of Esri's desktop products has enabled the delivery of large-scale geospatial datasets like CDL to desktops.
Each year, the CDL program focuses on highly intensive agricultural regions to produce digital, categorized, georeferenced output products. NASS uses ArcGIS Desktop to manage and edit administrative ground reference data such as the Common Land Unit (CLU) from the USDA/Farm Service Agency. The CLU data is a survey-based record of where specific crops are grown. That information is combined with satellite-based remote-sensing imagery to produce supervised classifications of each field within the state. Satellite imagery is provided by the Resourcesat-1 Advanced Wide Field Sensor (AWiFS), launched in 2003 by the India Space Research Organization.
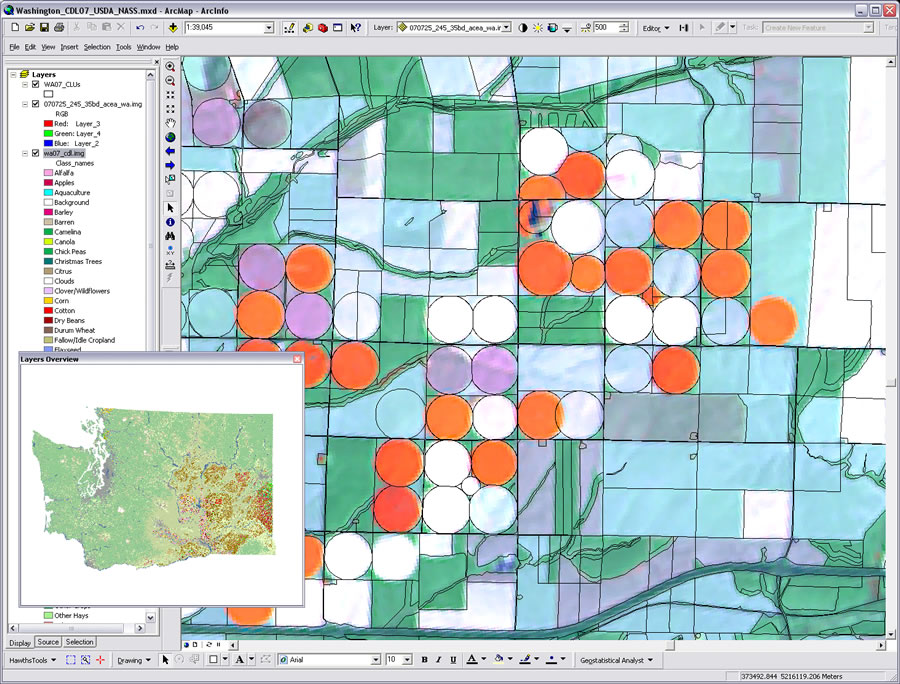 A raw AWiFS image dated July 25, 2007, is shown with Common Land Unit data overlay. The band combination displayed is 3,4,2. |
The CDL program was created in 1997 as an offshoot of the NASS Acreage Estimation Program, established to sync satellite images with farmer-reported surveys. Research and development have been ongoing since the mid-1970s to deliver real-time estimates of acreage at the state and county levels using remote-sensing science. Acreage estimates are used for legislation and government programs pertaining to agriculture. The CDL program is producing real-time acreage estimates over the Midwest and Mississippi River Delta areas for crop year 2008 and delivering a unique geospatial product to the GIS and remote-sensing user community.
For more information or to download the Cropland Data Layer, visit www.nass.usda.gov/research/Cropland/SARS1a.htm. For more information about GIS for agriculture, visit www.esri.com/industries/agriculture.