Esri Hosts Seminar on How to Use ArcGIS Software for Hydrographic Data Management
By Karen Richardson, Esri Writer
More than two dozen hydrographers and oceanographers from across Europe converged on Copenhagen, Denmark, earlier this year to talk about implementing a centralized hydrographic database and familiarize themselves with ArcGIS software.
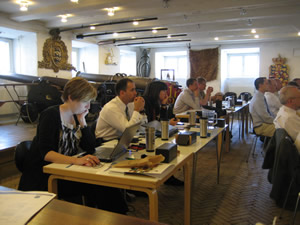
 Hydrographers and oceanographers attend Esri's hydrographic and data management production seminar at the Navel Museum in Copenhagen, Denmark. |
Esri's ArcGIS is starting to be adopted by hydrographic agencies, commercial chart producers, and naval commands for authoring and serving nautical data and products. The software supports nautical organizations in their main mission of ensuring safe sea navigation through better management of hydrographic data.
The gathering last spring at the Naval Museum in the Danish Maritime Safety Administration (DaMSA) was Esri's first hydrographic and data management production seminar. Representatives from hydrographic offices and agencies from six European nations charged with producing, managing, and serving nautical charts and other maritime information attended the three-day event. Esri plans to host similar seminars in other locations within the next year. Visit www.esri.com/nautical to watch for upcoming events.
Seminar participants learned how geographic information system (GIS) technology can effectively produce multiple products from one database, create and maintain hydrographic data, and provide vessels and other mobile units with up-to-date and accurate information.
Both printed chart formats and Electronic Navigational Charts (ENCs), which are official databases created by national hydrographic offices and are available over the Web, can be created using Esri software.
Esri's Professional Services Maritime Program manager Rafael Ponce and deputy program manager Timothy Kearns and spoke about the issues nautical agencies face, the considerations and challenges of moving from file-based systems to relational database management systems, how best to bring together disparate data, and how GIS uses and maintains nautical data standards.
Captain John Lowell, from Marine Chart Division of the United States' National Oceanic and Atmospheric Administration (NOAA), and Adam Jeff, a cartographer at NOAA, presented a case study outlining how the organization implemented Esri's GIS including ArcGIS Server, ArcGIS Desktop, and Production Line Tool Set (PLTS) for ArcGIS—Nautical Solution for its Nautical Chart System II (NCS II). PLTS for ArcGIS—Nautical Solution is an extension to ArcGIS used to create and maintain quality data for analysis and chart production. NOAA will produce more than 1,000 paper nautical charts as well as the equivalent ENCs using NCS II. All ENCs created will conform to the International Hydrographic Organization's S-57 standard. Lindsay Gee, managing director of Interactive Visualization Systems (IVS) 3D, an Esri business partner, discussed the integration of its suite of software, Fledermaus, with ArcGIS. Fledermaus is a 3D data visualization system that allows users to work with large, georeferenced datasets in a 3D environment. The software is used in the nautical industry to view and analyze seismic subsurface data and imagery such as maps, charts, mosaic video imagery, and satellite imagery. The integration will give ArcGIS users the ability to improve performance in bathymetric analysis, which provide information for nautical charts on the shape of the ocean bottom between chart depth curves, contour lines connecting points of equal depth under the water's surface, as well as surface modeling.
Attendees also walked through a typical nautical agency workflow scenario using Nautical Solution. By loading data, exploring navigational and nonnavigational data, and producing an ENC, they gained an understanding of how both paper charts and ENCs can be managed and produced using GIS.
As a longtime user of Esri software, DaMSA was the perfect host for the three-day event. A department of the Danish Ministry of Defense, DaMSA is responsible for helping vessels safely navigate the Danish, Faroese, and Greenland waters.
DaMSA uses GIS for collecting bathymetry data, such as water temperature, currents, and wave heights, that oceanographers need to forecast and model ocean parameters that allow ships to navigate at sea. DaMSA collects the data and sends it to the Danish National Charting Agency, which produces nautical charts as paper and ENCs. Read how Esri software is used in nautical organizations. Learn more about ArcGIS for PLTS—Nautical Solution.