Impact of Climate Changes on Gray Whale Feeding Grounds Tracked with GIS
By Maggie Jones, Esri Conservation Writer
The mammoth, 40-ton gray whale is nourished by microscopic phytoplankton, plants that contain chlorophyll and depend on nutrients in the ocean to survive.
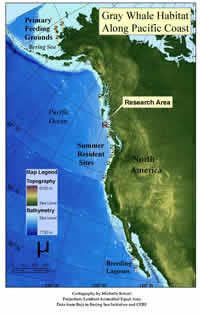 Migrating Gray whales stop to feed in areas rich with chlorophyll fed shrimp (coded with a 2). Researchers in area R analyzed relationships of water temperatures, base food chain elements, and whale behavior patterns. |
Phytoplankton are a link in a remarkable food chain; they serve as the primary food for shrimp and other crustaceans, which are the life source of gigantic gray whales. Researchers at Coastal Ecosystems Research Foundation (CERF), a Canadian nonprofit organization, have attempted to link the concentration of chlorophyll a, the blue-green pigment in phytoplankton, to gray whale distribution in order to better understand the relationship between whales and their feeding grounds. They are tracking the concentration of chlorophyll a in the ocean using geographic information system (GIS) technology, a process that could be crucial in sustaining the gray whale herds that populate the Pacific Ocean.
Spring Journey North
Every spring, gray whales make the long journey up the Pacific coastline from Baja California to feast on the swarming mysid shrimp found among kelp beds along the rocky coast of British Columbia, Canada. Many gray whales go further north into the Bering and Chukchi seas, feeding on benthic macrofauna. As early as the 1980s, the whales began looking for alternative feeding grounds, and the question arises whether this is the result of insufficient nourishment.
Michelle Kinzel, a CERF researcher, and Roberto Venegas, a research scientist with the College of Oceanic and Atmospheric Sciences (COAS) at Oregon State University, suspect that global climate changes are altering food webs and impacting all types of species within a coastal ecosystem. Kinzel and Venegas used GIS to track the distribution of gray and humpback whales, as well as the availability of food in their feeding grounds, to see if climate change affects whale distribution and behavior.
CERF has collected data on the number and distribution of gray whales visiting the summer feeding grounds since 1996 by means of sight and satellites. Whales can be tracked by visually identifying markings distinct to individual whales. This descriptive information can be put into GIS, to generate maps, which depict the factors that influence a specific whale's choice of feeding grounds and show changes in those factors over time.
Satellite Imagery Used
CERF used imagery obtained using a Sea-Viewing Wide Field-of-View Sensor (SeaWiFS) instrument aboard a satellite to study the relationship between whale distribution and concentrations of chlorophyll a. Color in the world's oceans is in the visible light range and varies depending on the amount of chlorophyll and other plant pigments in the water; the intensity of green color in the ocean is a direct measurement of the amount of phytoplankton. Quantification of variations in chlorophyll a levels was derived from the SeaWiFS data taken from various sampling stations off the coast at sites selected using GIS analysis.
To determine where whales were congregating, researchers observed individual whales and referred to their residency patterns, recorded with GPS and processed with GIS. (Residency patterns are determined by geographic locations, numbers of whales returning to an area, and the number of days they feed there.) Researchers found that whales exhibit site fidelity, meaning they often return to the same feeding grounds year after year. This discovery enabled the team to apply control variables to the study of feeding patterns. Researchers used Esri's ArcView software to visualize this data, better understand its geographic context, discover relationships, and identify patterns in whale activity.
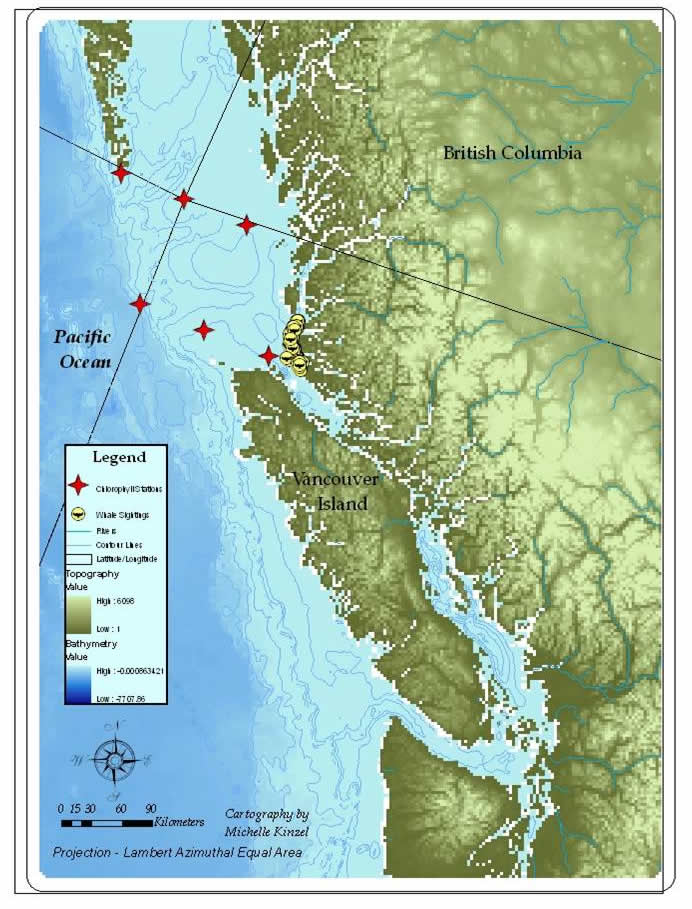 Red stars indicate buoys that collect chlorophyll data information near a whale feeding ground. Yellow circles symbolize whale sightings. |
Using Animal Movement (an ArcView Spatial Analyst extension), they analyzed habitat usage in terms of site fidelity to try and discover why the whales were seeking new feeding grounds. The researchers hypothesize that fluctuations in sea temperature affect the base food chain element chlorophyll, impacting shrimp density and, therefore, the change in whale food supplies from year to year.
Whales Expand Their Ranges
By determining the range that whales traveled, the team quantified core areas (areas where whales spend 50 percent of their time) and home ranges (areas where whales spend 95 percent of their time). Data gathered from 1995 to 2001 was delineated using GIS technology, and maps were studied to analyze trends and correlations between whale home ranges and residency patterns relative to anomalies or fluctuations in chlorophyll concentrations. Kinzel and her team found that the size of gray whale home ranges expanded in 1998 and 1999 compared to 1996 and 1997.
The tracked whales expanded their home ranges because they stayed in their typical feeding grounds for shorter periods, then dispersed to find new feeding areas. The years the whales expanded their ranges corresponded with the years of the El Niño and La Niña climate changes. In particular, home ranges were largest during La Ni�a years. Major shifts in oceanographic processes are caused by the El Niño phenomenon, a warming of the ocean's surface when currents of nutrient-poor tropical water replace the cold, nutrient-rich surface water that supports great populations of fish and nourishment. La Niña cools the surface of the water, also disrupting marine habitats. Kinzel and Venegas hypothesized that whale residency and site fidelity correlate to the availability and suitability of food.
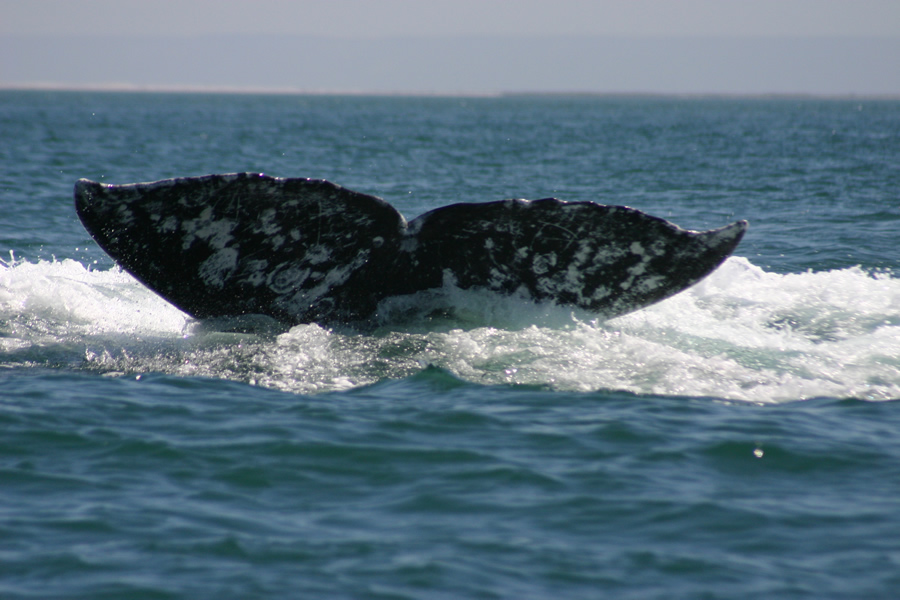 The whale tail fluke shows distinctive markings that allow researchers to track behaviors and patterns of individuals within a population. |
The climate change seemed to have caused a shift in the primary food dominating shallow water communities, from several species of swarming mysid shrimp (the gray whales' main nourishment source) during non-El Niño years to schooling anchovy fish (the humpback whales' food) common in the warmer currents of El Niño events. That shift could be a driving factor in the whales' change of feeding ground preference.
Because restrictions such as limited data points hinder making a decisive correlation between chlorophyll a concentration and whale distribution, the jury is still out. Nonetheless, the methodology of employing satellite imagery to better understand ecosystem-based processes and analyze animal behaviors has prospects for application in other environmental research studies.
The idea that changing chlorophyll a levels directly affect the entire food chain, from phytoplankton to shrimp to whales, deserves further investigation. CERF researchers are continuing to assess whale habitats to prove their hypotheses as well as establish a geodatabase that will serve as a reference for whale habitat management and conservation. To read more about whale research projects in Baja and British Columbia, visit the CERF Web site at www.cerf.bc.ca. To learn more about Kinzel's gray whale project, e-mail her at kinzelm@science.oregonstate.edu.