Habitat Maps Created with GIS Aid Alberta with Grizzly Conservation
By Maggie Jones, Esri Writer
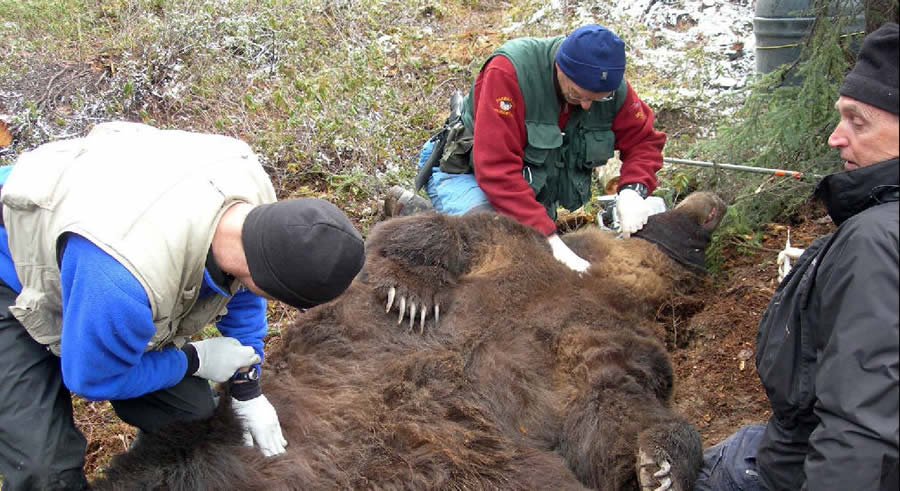 Veterinarians and researchers from the Grizzly Bear Research Project place GPS collars on the bears, monitor the animals' vital signs, and draw blood to check for stress hormones. Photo/Gord Stenhouse. | |
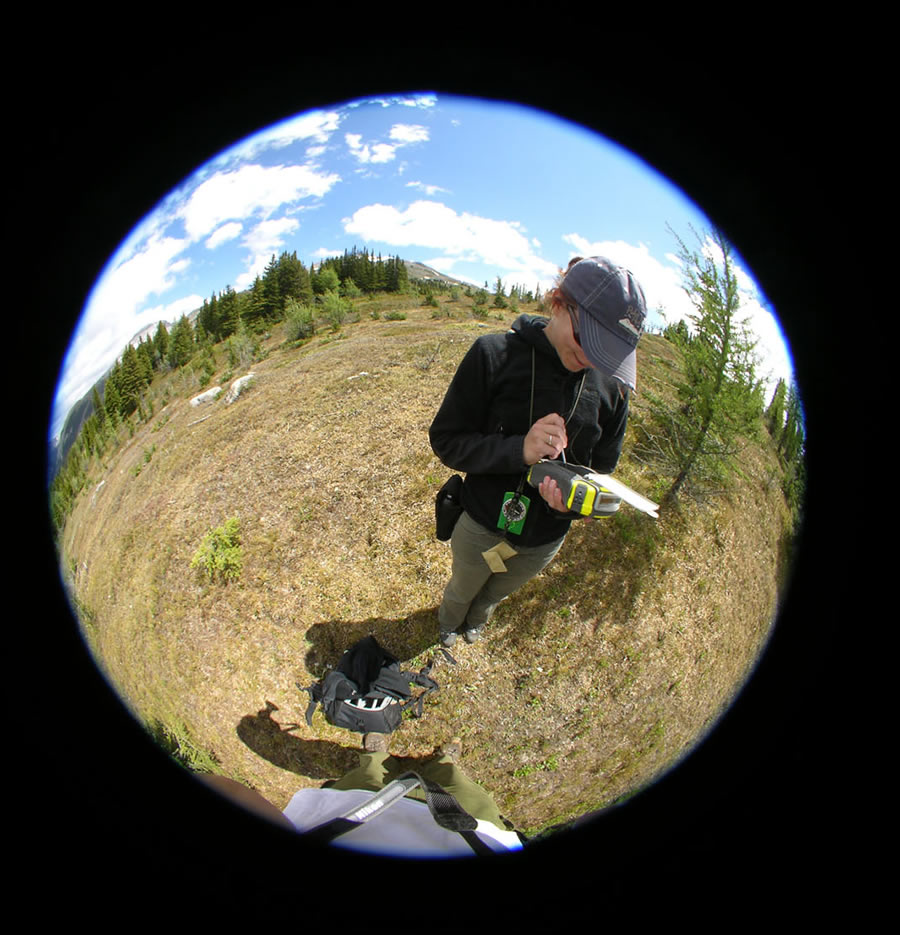 Researchers record important bear habitat information and locations on handheld GPS units. Photo by David Laskin. | |
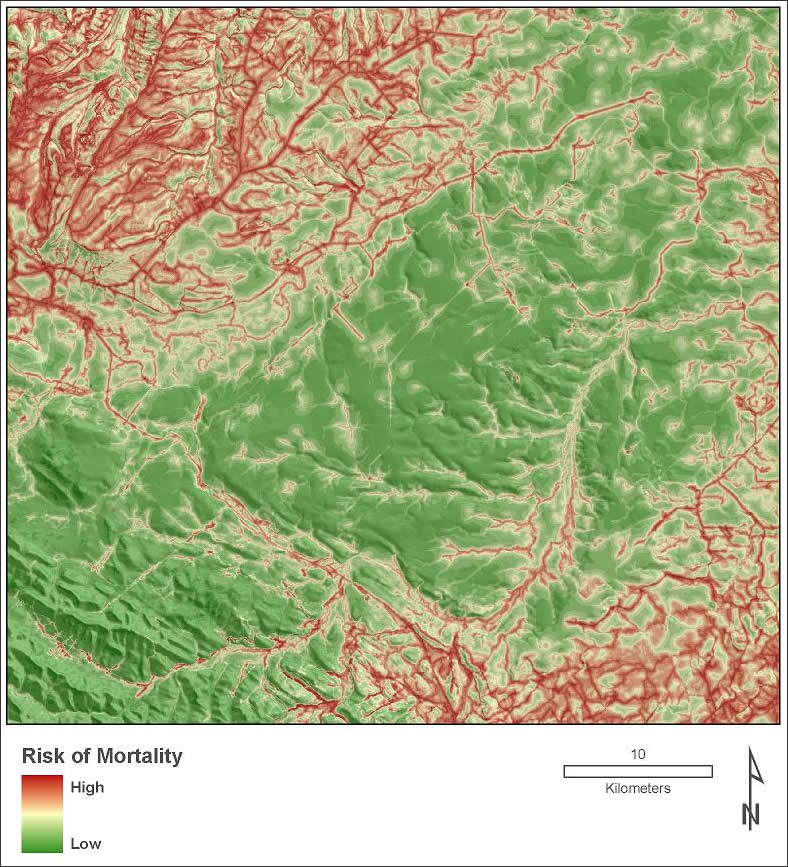 A GIS map shows the areas in Alberta where grizzly bears suffer a high mortality rate. |
The ferocious and majestic grizzly bear is made feeble and meek from habitat degradation and stress caused by urban development, natural resource extraction projects, and illegal hunting in the areas where it roams.
The powerful grizzly bear, with a range spanning across northwestern North America, can grow to well over 1,000 pounds—appointing it the king of the forest. However, the grizzly population has started to decrease rapidly because of habitat encroachment such as urbanization and the harvest of natural resources. In the wilderness of Alberta, Canada, the population of more than 1,000 roaming grizzlies has been reduced to fewer than 500 in just a few years.
Enter the Grizzly Bear Research Project (GBRP), a Foothills Research Institute (FRI) program dedicated to improving grizzly conservation in Alberta. The GBRP provides knowledge and planning tools, such as habitat maps, to land and resource managers who want to harvest timber, conduct mining operations, and drill for oil within the province. These maps, created using geographic information system (GIS) software, help decision makers better manage and safeguard the grizzly bears' habitat and educate the public about the bears.
"Considering that there were thousands of grizzlies in the region when it was settled over a hundred years ago, the dwindling numbers today make the future of Alberta's grizzly bears look particularly bleak," said David Laskin, a GIS analyst on the project. "Grizzlies are an iconic symbol of the Canadian Rockies and the Albertan wilderness; without them, everyone who lives here would be affected in some manner. As a result, there has been considerable public support for developing an effective management plan for the remaining bears, and progress has been made."
A Plan for Habitat Conservation
The GBRP team of researchers and scientists devised a strategy in 1999 to monitor the health and population of the grizzlies for scientific purposes. When the grizzly population declined, the team changed its focus to a conservationist mission.
The concerned members now seek to provide bear health, habitat, and range information to businesses, government officials, scientists, and conservationists. FRI works directly with industry managers and planners to mitigate the negative effects caused by development and public access to forested areas, working to find simple solutions such as rerouting roads or planning new roads for the least possible impact on bear habitat.
GIS analysts use GIS technology to produce habitat, probability of bear habitation, and bear travel corridor maps. The reports and maps provide an understanding of grizzly bear health and how it relates to the landscape and environment. GIS allows people to view data as maps rather than columns of numbers, making it easier to read and understand. GIS can layer different types of point information on top of a basemap. Point data collected with GPS that shows the location of bears enables the team to identify areas at risk of human-caused mortality.
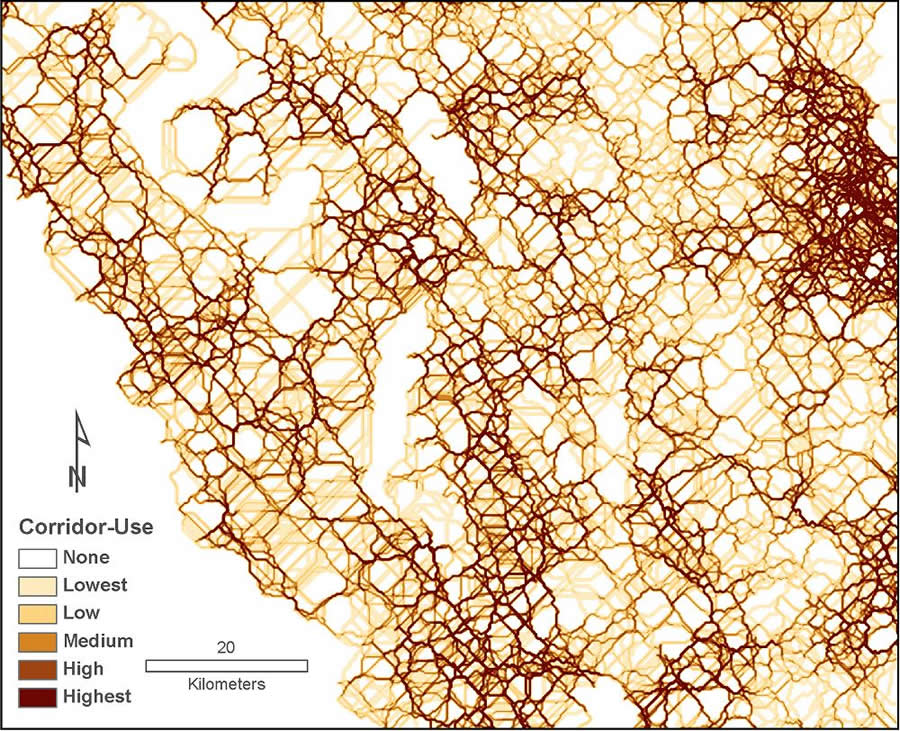 Bear corridors are mapped using GIS. | |
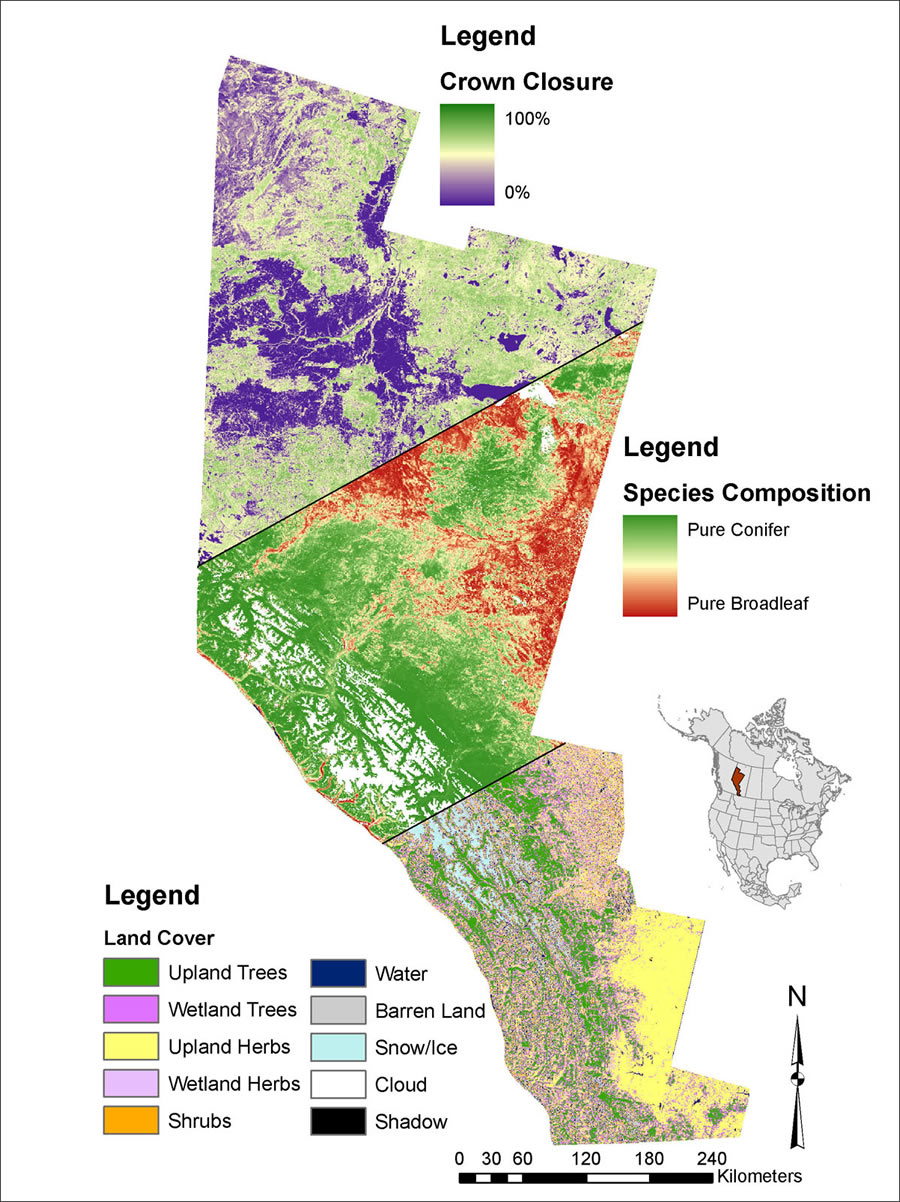 This habitat base map combines a variety of data layers including trees and shrubs. | |
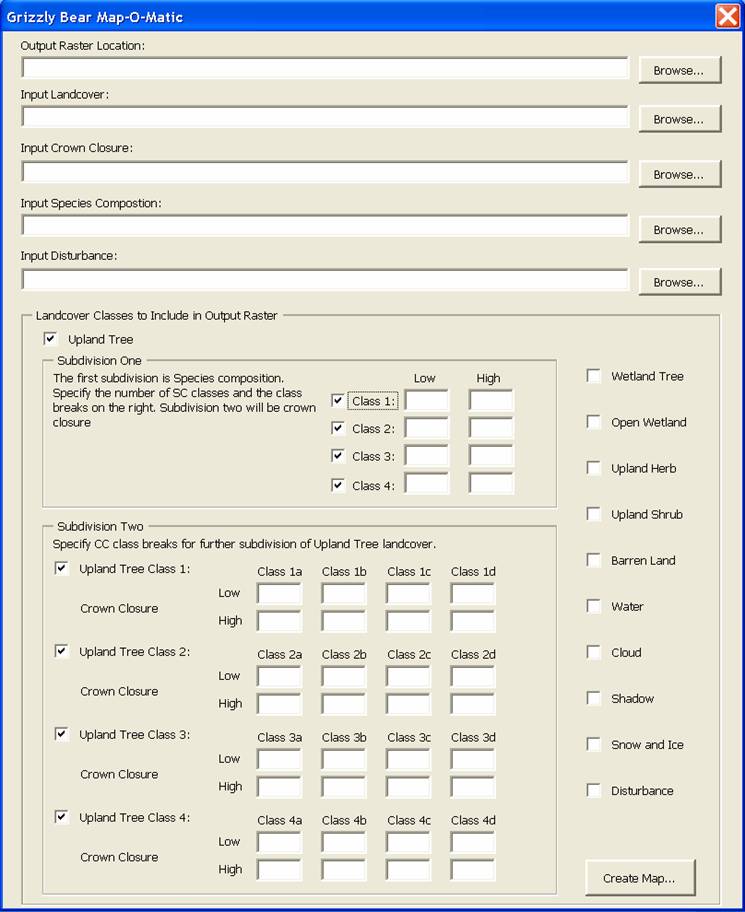 The Map-O-Matic tool inputs basemaps and outputs a composite map that contains user-defined classes. |
"The reasons for population decline in Alberta are manifold," said Laskin. "However, the dominant factors impacting grizzly mortality are human caused. As development increases and encroaches on grizzly habitat, the number of animals getting hit by cars increases significantly. Furthermore, these roads, trails, and cut-lines provide access for illegal hunting." Laskin added that these direct threats are compounded by the bears already having particularly low reproductive rates when compared with other grizzly populations in North America. This may be due to the bears experiencing more stress because they have to share prime habitat with human activities such as natural resource extraction, recreation, and urban growth. The more resources FRI can use to educate Albertans about what affects grizzly health, the safer the bears will be—this is where the habitat maps come in.
Mapping the Grizzlies in the Field
People constantly change the landscape by building houses and roads as well as harvesting natural resources. GIS technology offers a way to make dynamic maps that are able to keep up with those changes. The GBRP team members create grizzly bear habitat maps that display data layers of land cover, tree canopy cover, and tree species, then plot grizzly movement data on top of this vegetation data. First, the landscape data for the habitat maps is derived from Landsat satellite images; then, each summer, field crews visit hundreds of locations within the extent of the satellite images and record the land-cover type and forest characteristics with handheld GPS and PDA devices. Esri's suite of GIS products was selected for this project because they can be used on handheld devices, personal computers, and server networks. The team uses Esri's ArcPad, a mobile GIS product that enables easy on-site data collection and analysis. The data collected in the field is brought to the lab and converted to shapefiles. These shapefiles are then used in ArcGIS Desktop (ArcInfo) software to create the three main raster map products: land cover, crown closure (the density of the forest canopy), and tree species composition, which are combined to derive grizzly habitat-use models.
Landscape structure is important when defining grizzly habitat. Forest canopy information can reveal to researchers where grizzlies are likely to be found. Grizzly bears prefer to use open forests and meadows to forage for berries and vegetation; however, proximity to dense forest is crucial to provide a safe retreat from potential threats. When mapping land cover—the trees, shrubs, wetlands, water, or barren regions of a study area—the satellite images are "stitched" together using the Mosaic tool, which is one of the many tools ArcGIS users can apply to their projects. Because the openness of a region affects whether a grizzly will want to forage there, the density of the crown closure across the study area is examined. The crown closure is derived using a multitude of digital hemispherical photos taken within a study plot below the canopy. A plot is the forest area beneath a single image pixel in the satellite imagery. The photos are processed in the lab and converted into measurements of crown closure for each plot. The results are compared with other environmental, topographic, and spectral information used to derive a linear statistical model.
Next, researchers apply the calculated results to other image pixels, and GIS estimates the raster values (geographic feature cells) for the entire crown closure map. The tree species composition map shows the proportion of conifers within the forested habitat area. This map is derived from random samples of tree species in each study plot. Back in the lab, the ratio of broadleaf to needle-leaf trees is entered into a statistical model and correlated with underlying environmental, topographic, and spectral information. Similar to the crown closure maps, this relationship is applied to every pixel in the satellite image to create the tree species composition map.
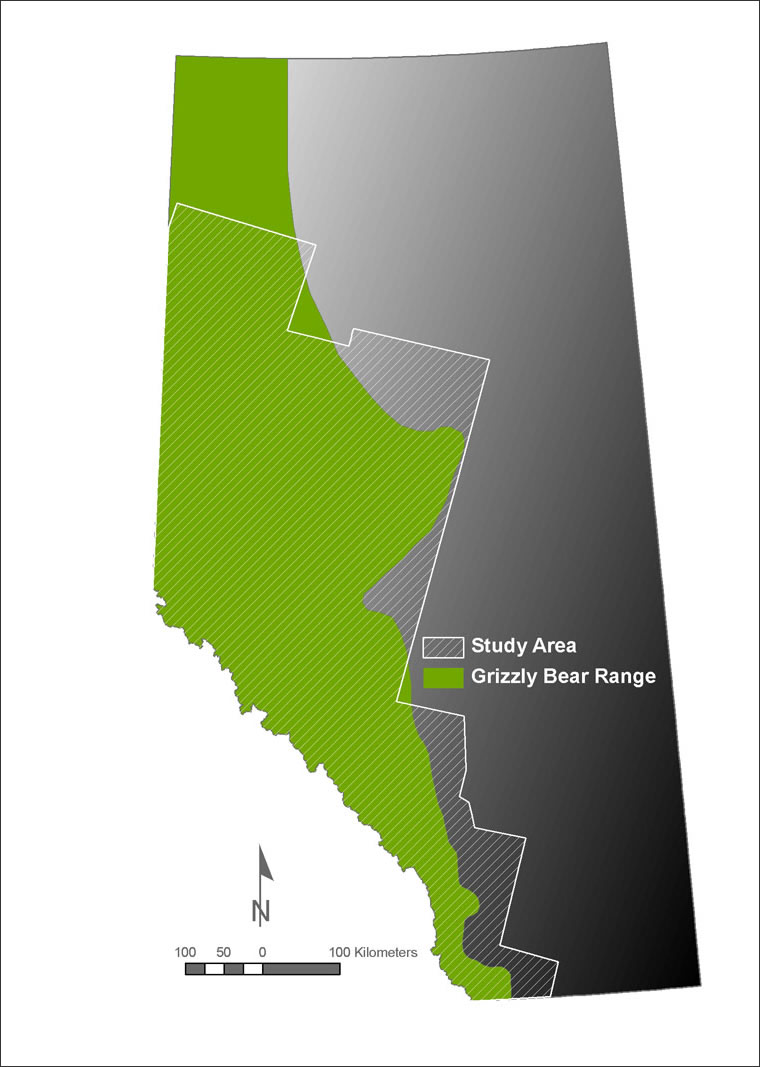 Grizzly bear range and study area in Alberta, Canada. | |
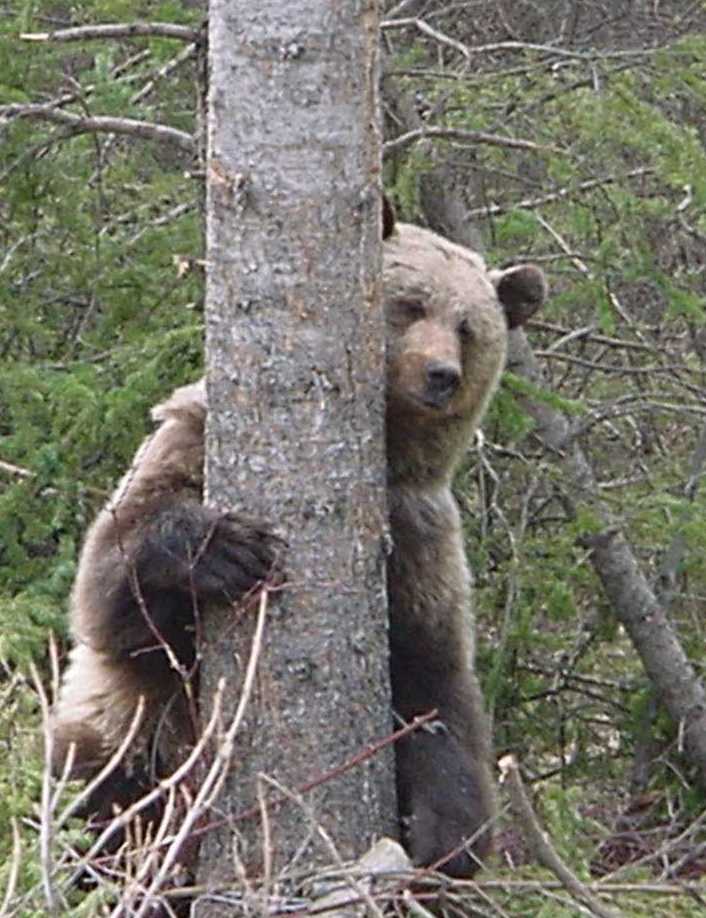 A grizzly bear hugs a tree in Canada. Photo/Gord Stenhouse. |
Researchers needed to ensure that they would be able to combine the basemaps in a variety of ways. "Because ecosystems are very complex and dynamic entities, static land-cover maps are limited in their use due to the wide range of queries researchers have about bears and their habitats," Laskin said. Questions about grizzly ecology are constantly being answered, which opens the door for new questions to be asked. Laskin also said that combining basemaps in a customized manner allows researchers to have a suite of maps that is as flexible as the ever-evolving research focus.
To give them this flexibility, project technicians developed a Microsoft Visual Basic tool called Map-O-Matic. This tool inputs basemaps and outputs a composite map that contains user-defined classes. Obviously, researchers need to go into the forest to obtain the grizzly location data. They tag bears with GPS collars that will transmit bear locations via radio waves to the base station. To do this, team members tranquilize the bears—from a great distance, of course. Then, while the bear is in a sleep state, scientists record its vital signs, take DNA samples, and document other characteristic data. For example, wildlife veterinarians monitor the stress of the bears they collar by identifying certain long-term stress hormones in their blood. The collar is released remotely and falls off after about a year so that no harm comes to the grizzly.
The location data collected by the GPS and sent to the base station is stored in the database and combined with the basemaps by GIS technicians to create habitat-use maps that show the grizzly range and the probability of risk. The team performs a landscape change analysis that monitors annual appearances of clear-cutting, fires, oil well sites, roads, and pipelines across the study area. This change information, combined with GIS habitat basemaps and grizzly location points collected with GPS, enables conservationists to monitor bear health and the effects of changing landscapes on bear habitat.
Results of the Research
The preliminary results of combining basemaps and landscape change, bear location, and bear health data suggest that grizzlies in areas of increased road density experience the highest levels of long-term stress. This type of stress could potentially impact their ability to forage or reproduce and therefore harm the overall well-being of the local bears. Habitat maps also help researchers analyze various land-cover classes and their changes, the probability of a bear being in a certain area, bear movement corridors, and areas of mortality risk. GIS gives researchers and managers a better perception of data for improved decision making and planning for grizzly conservation.
For more information about the project, contact David Laskin at dnlaskin@ucalgary.ca.