ArcWatch: GIS News, Views, and Insights
October 2012
How Do People Lean Politically in Pivotal Swing States?
GIS Technology and Data from Esri Were Used to Analyze Demographics and Types of Voters in the Battleground States of Iowa and Florida
Voters in Iowa and Florida are being courted heavily in the weeks leading up to the presidential election on November 6. President Barack Obama and challenger Mitt Romney have already visited several times. Political advertising for the two candidates dominate television and radio, and phones there are ringing off the hook with robo calls.
Campaign staffs always look for a competitive edge. And with the race being tight, understanding the demographics of these two critical swing states and knowing where to find their candidate's constituencies will be critical in driving voter turnout and determining who wins the presidency. GIS technology such as Esri Business Analyst for Desktop and Esri data can help campaigns do the following:
- Target voters for "robo calls"
- Determine where to direct fundraising appeals
- Direct where to "get out the vote" drives
- Decide where to send candidates for appearances
- Determine where to mail flyers
- Decide where to post signs and billboards
- Identify where to send volunteers to canvas for votes
In Florida and Iowa—as in many of the other battleground states of Colorado, Nevada, New Hampshire, North Carolina, Ohio, Virginia, and Wisconsin—support for both candidates is almost evenly divided. This means a combination of wins in several states could tip the election to Obama or Romney. That's why it's especially important when targeting voters for messaging, enlisting them as volunteers, or soliciting contributions in these swing states, to learn the political leanings and locations of key voting blocs, such as women, Hispanics, and Blacks.
Enlisting Esri Technology and Data
Campaigns can study demographics and voters' political leanings in the swing states using Esri software and data. Business Analyst for Desktop software can be used to analyze consumer behavior data from the Market Potential, Consumer Spending, and Tapestry Segmentation databases.
This data can help identify where each candidate's supporters are highly likely to live, down to the ZIP code or even US Census Block Group. The campaigns can use this data to find the best location for advertising, identify meet-and-greet locations for candidates, and better understand local issues. At a higher level, the data can show people's spending patterns, what types of interests they pursue, and where liberals and conservatives live, enabling candidates to find pockets of supporters. Knowing this will help them target and craft their messages more effectively.
Analyzing Demographics in Florida and Iowa
Let's examine the demographics and political leanings of Florida and Iowa voters using Esri data and Business Analyst for Desktop. Demographics in Florida and Iowa differ greatly from each other as well as from the United States (US) as a whole; each geography has a different composition in terms of age, ethnicity, race, and interests.
Florida has an older population than the US as a whole. The median age is 40.9, a little older than the US median age of 37.2 years. Even more telling, 17.5 percent of the population is aged 65 years or older, compared with 13.2 percent of the US population. The state has a higher percentage of females than the rest of the US—51.2 percent compared to 50.8 percent. This margin of 0.4 percent may seem small, but it could make a huge difference in the election results. Some political analysts and journalists say that the most important voting blocs during this election will be women and minorities, especially Hispanics.
Hispanics make up 22.9 percent Florida's population. That's higher than the national average of 16.6 percent and may be due to Florida's proximity to Cuba and the rest of Latin America. The percentage of Blacks in Florida is higher than the national average as well. If a high percentage of minorities vote, it could have an important effect on Election Day because minorities tend to vote Democrat. In 2008, Florida's electoral votes went to Obama.
While Florida does have a higher than average minority population, which might favor a Democratic candidate, economic and financial factors may cause many to vote Republican. Financial well-being greatly affects how people vote. Florida's unemployment rate of 8.8 percent in July 2012, up slightly from the 8.7 percent rate in January 2009 when Obama took office, is just slightly higher than the national unemployment rate of 8.1 percent in July 2012. Other important financial and economic factors that might affect how people vote include how secure they feel about their jobs, if they are underemployed, how much money they make and their current net worth. Florida's median income and net worth are just slightly lower than the national average.
Key Demographic and Financial Statistics for Florida and Iowa versus the US, 2011
| Demographic Variable | Florida | Iowa | US |
|---|---|---|---|
| Median Age | 40.9 | 38.1 | 37.2 |
| % Male/% Female | 48.8%/51.2% | 49.3%/50.7% | 49.2%/50.8% |
| % Hispanic Population | 22.9% | 5.1% | 16.6% |
| % Black Population | 15.3% | 2.7% | 12.5% |
| Diversity Index | 61.9 | 23.3 | 61 |
| Median Household Income | $49,910 | $50,326 | $50,227 |
| Median Net Worth | $89,018 | $91,682 | $93,084 |
Iowa has very different demographics. The median age is higher than the national average—38.1 versus 37.2. The male/female ratio is almost identical to that of the US as a whole—50.7 percent female in Iowa versus 50.8 percent in the United States overall. There are few Hispanics or Blacks in the state; their percentages are much lower than the national averages. Overall, Iowa is not very diverse, according to Esri's Diversity Index, part of the 2011/2016 Updated Demographics database. Esri created a proprietary Diversity Index that measures diversity on a scale of 0 to 100. The Diversity Index is defined as the likelihood that two persons, selected at random from the same area, would belong to a different race or ethnic group. Iowa's Diversity Index of 23.3 is significantly lower than the US Diversity Index of 61.
Iowa's unemployment rate in July 2012 was 5.3 percent—much lower than the national average of 8.3 percent and down from 6.1 percent in January 2009, when Obama took office. The median household income is slightly above the US average, and the net worth is just below, according to Esri.
Iowa's demographic makeup is more similar to that of Republican Party members, but voters who live in a state with a low unemployment rate may be satisfied with the current administration and vote Democratic.
People's Political Leanings
Many people vote based solely on party preferences. Of course, voting behavior can change based on their experiences, circumstances, or the economic climate at the time of the election. Knowing the political leanings (which may be separate from a person's party preference) of people living in a certain area can help a candidate localize and target messages in campaign speeches, television advertising, flyers, and robo calls. Candidates want to reach the right audience, and analysts want to know where undecided voters are located so they can target them in polls. While Esri's Market Potential Index indicates both Florida and Iowa show conservative leanings, a person in Iowa is more likely to be conservative than a person in Florida.
The Esri Market Potential Index (MPI) measures the probability that adults or households in a specific area will exhibit certain consumer behaviors compared to the US average. The index is tabulated to represent a value of 100 as the overall demand for the United States.
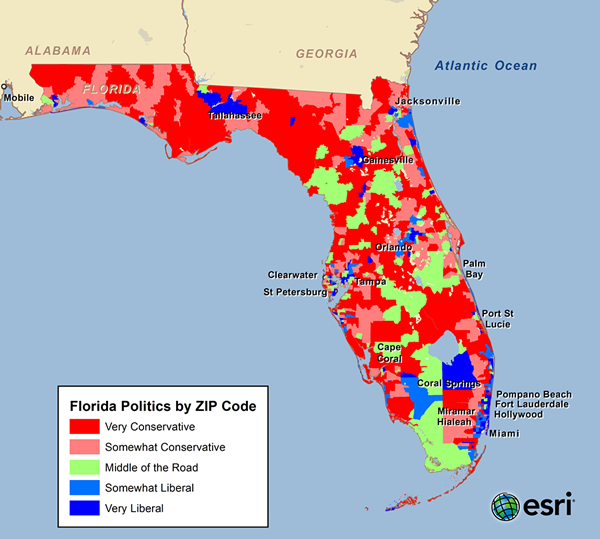
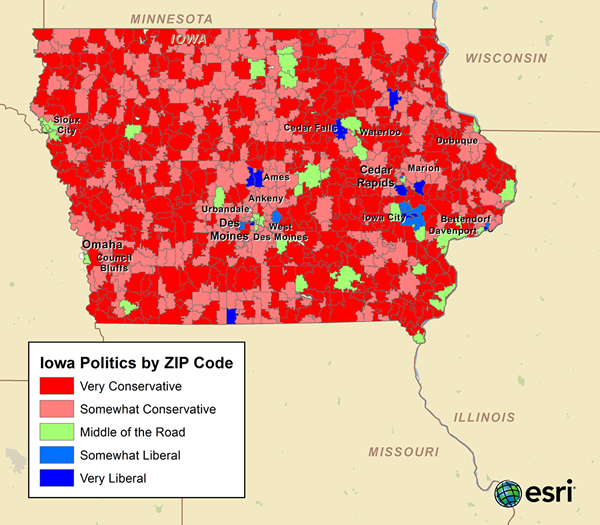
Political Leanings in Florida and Iowa
| Market Potential Variable | Florida | Iowa |
|---|---|---|
| Consider self very conservative | 104 | 112 |
| Consider self somewhat conservative | 103 | 109 |
| Consider self middle of the road | 100 | 108 |
| Consider self somewhat liberal | 99 | 84 |
| Consider self very liberal | 94 | 83 |
People's political positions tend to vary across each state. Neither Florida nor Iowa is homogeneous in its views. Both states have areas of very liberal and very conservative voters. Esri's MPI for each political classification (e.g., very conservative, very liberal) indicates the likely leaning in each area as compared to that of the average American.
In Florida, by ZIP code, the most liberal areas are near large cities such as Miami and Tallahassee. For example, Miami ZIP code 33131, with an MPI of 303, indicates that a resident there is more than three times as likely as the average American to consider himself or herself very liberal.
More conservative areas are found away from the large cities. The MPI for Orlando, ZIP code 32834, is the highest at 214, where people would be more than twice as likely to be conservative than the average American.
In Iowa, the dominant political leaning is very conservative, but there are liberal areas around Des Moines and Cedar Rapids, two of the largest cities. The MPI indicates that residents in Iowa City ZIP code 52242 are more than twice as likely as the average American to be very liberal. Residents of Ricketts, a small town in western Iowa with ZIP code 51460, are more than twice as likely to be very conservative.
Who Will Win?
GIS and the demographic and consumer data alone will not answer that question, but does help. The Obama and Romney campaigns could use it to better understand the types of voters who live in different parts of the country. Candidates can not only find the voters who support their ideologies, but also voters who are undecided. They can then use specific messaging to target voters and remind them to go out and vote.
This data also can help political analysts predict how voters in an area may cast their ballots. Esri's Updated Demographics, Market Potential, and Consumer Spending data, combined with regional economic and political information, can help to inform analysts about a potential outcome in a region.
It is clear from studying people's political leanings in Florida and Iowa that the presidential race is going to be extremely close. The outcome will likely come down to how people feel on Election Day—and who shows up to vote. Stay tuned on November 6 to find out the results.
Pam Allison is a digital media, marketing strategist, and location intelligence consultant. You can visit her blog at www.pamallison.com.