GIS: Changing the Way Archaeologists Analyze and Interpret Their Finds
By Bob Booth, Esri Archaeology User Interest Group Coordinator
In archaeological parlance, provenience refers to the location at a site where an artifact was unearthed. A pit in the northwesternmost room at a particular ruin, for example, might be the provenience for a group of pottery shards that fit together. Reconstructing these fragments from this context might lead to the interpretation that the pot was a utilitarian storage vessel. The pot's significance, then, is different than it would be had it been found in a grave or beneath a great plaza's floor. Archaeologists record the provenience of all artifacts. They interpret sites and develop theories about ancient cultures by studying the patterns they observe in the types, quantities, and locations of artifacts, ecological indicators, and architectural features that they find. Today geographic information system (GIS) technology can help archaeologists store, retrieve, visualize, and interpret this spatial data.
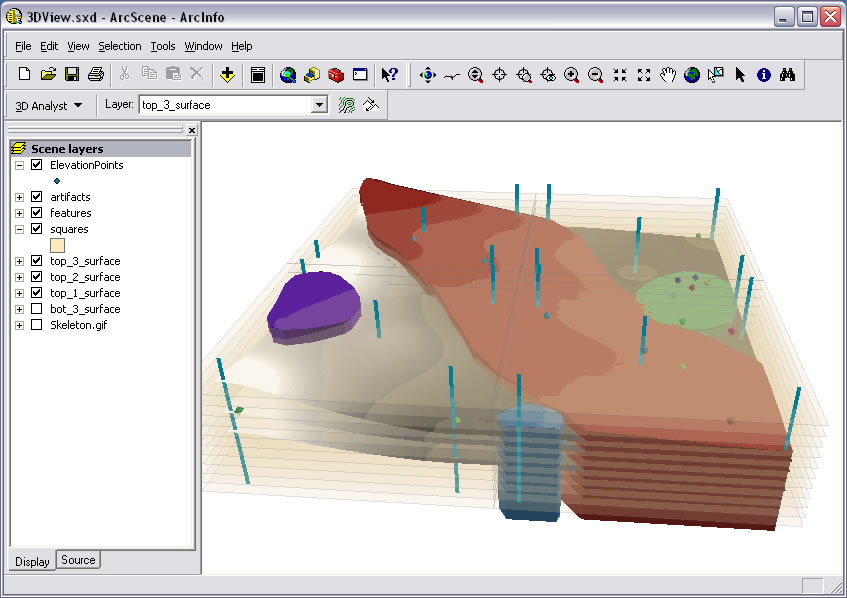 Archaeologists can create elevation surfaces for individual levels (strata) within a site based on opening and closing elevation measurements of excavation units. Artifacts and features from the site can be shown in 3D, draped on or extruded through the appropriate levels. |
Centuries ago, when people started practicing archaeology as a hobby, little thought was given to mapping the context of ruins or relics. Antiquarians would venture out, find an interesting artifact, and bring it home. The focus was on the artifact or the ruin. There was some tie-in to history in that these people thought of the relics that they found as connections to the mythic past, which led to questions such as, Is this so-and-so's castle? or Is this so-and-so's sword? However, people had no idea how much time depth there was to the past or how complicated the past turns out to be.
Sorting out all the complications is where GIS comes in. Today location lies so much at the heart of archaeological research that it is clear that GIS technology will play an increasingly larger role in the work.
Archaeologists were at first slow to adopt GIS, in part because the technology was difficult to obtain and the available data limited. But that began to change in the 1990s, thanks in part to the availability of better terrain and ecological data. Remote- and geophysical-sensing equipment and methods improved, the quality of aerial photography and satellite imagery went up, and the global positioning system (GPS) became much more accessible. Improvements in computing power, display, output technology, and software have made GIS more powerful and easier to use.
Although much work is still being done using static maps, the percentage of archaeologists who are beginning to adopt GIS to map, manage, and analyze sites and collections is increasing. Some archaeologists are starting to take laptops into the field and using ArcGIS to do their mapping. Others are recording site data on paper and transferring the data into a GIS at the end of each day or week of the field season. GPS units are becoming standard equipment for archaeological surveys, and some archaeologists are now taking their GIS data with them, too, connecting ArcPad to their GPS to locate and record sites.
GIS has much to offer. If an archaeologist links the geometry of features from an excavation site to collection data tables using GIS, he or she can dynamically update the maps to show, for example, all the rooms that date to a specific time period or the rooms where a certain type of object was found. Instead of sitting at a drafting table to create a single site map, archaeologists can now sit at their computers and make the same basemap with their GIS software. The time required to add the feature geometries to the GIS is no greater than that previously invested in manually drafting static site maps or using CAD or drawing packages to create illustrations for publication. However, after they draw in the features and attribute them with feature identification numbers, they can use database join operations to link data from analysis tables to the map. This lets them interactively create multiple maps showing different aspects of the collected data. This is a powerful new way for archaeologists to explore and present their findings.
Spatial patterns that are obscure when seen in tables and graphs quickly become apparent using GIS. For example, without a GIS, an archaeologist studying stone tool manufacturing at a site might look at the collection data tables and identify peaks on a histogram that represent excavation units with high volumes of toolmaking debris. They would then need to refer to a hard-copy map of the site to see how those units are related spatially. However, when using a GIS, the archaeologist can easily plot the toolmaking data on the map and see the patterns immediately. The archaeologist might use dark green to represent high concentrations of stone tool flakes and light green to represent low concentrations of stone tool flakes. After spotting a spatial pattern, he or she could resymbolize the data to show the ratio of one type of stone tool flake to another (or the ratio of flakes to tools or to another artifact type, etc.).
Archaeologists from the University of California at Santa Barbara did this at a site known as Jiskairumoko in Peru, where they used ArcView to manage and visualize data from a site where they were studying the transition from hunting and gathering to a herding lifestyle.
Archaeologists used GIS to map the distribution of artifacts and different types of construction materials in an ancient Roman city in Tunisia called Uthina. The mapping project helped them interpret changes in the city as it transformed from a large Roman community to a smaller Islamic community.
GIS is also being used by archaeologists to develop predictive models to help planners decide which areas may be unsuitable or too expensive to develop (for projects such as new highways) because of the high chance of encountering large numbers of sites.
In the future, more archaeologists will use GIS to share their results via the Web, to visualize site data in 3D, to create animations, and to create and visualize multidimensional datasets. With the upcoming release of Esri's ArcGIS 9.2 software, there will be support for 2D animation of time series data in ArcMap. That will be useful as an additional visualization tool. GIS will also be used to present archaeological and historical information to students and the public. For example, museum visitors or history students could see the Roman Empire rise and fall in an animated time series that shows the land mass of the conquered territories expand and shrink over time. The same could be done to show changes over time in the population of Neanderthals as they disappeared from Europe and Asia.
For more information about how to use GIS in the field of archaeology, visit Esri Natural Resources.
Bob Booth works as a product engineer in the Software Products Group at Esri. He earned his Bachelor of Arts degree in anthropology from Rice University and received archaeological field experience while working on research projects for Virginia Commonwealth University, Rice University, and the University of Wyoming. He also worked in the collections department at the Museum of Northern Arizona, where he introduced GIS in the form of Esri's ArcView and began digitizing some of the thousands of known archaeological sites throughout Arizona.