GIS Helped Multiple Agencies Respond to Southern California Fires
By Jesse Theodore, Esri writer
Geographic information system (GIS) software and services from Esri helped local, state, and federal agencies with multiple tasks during the October firestorms in Southern California.
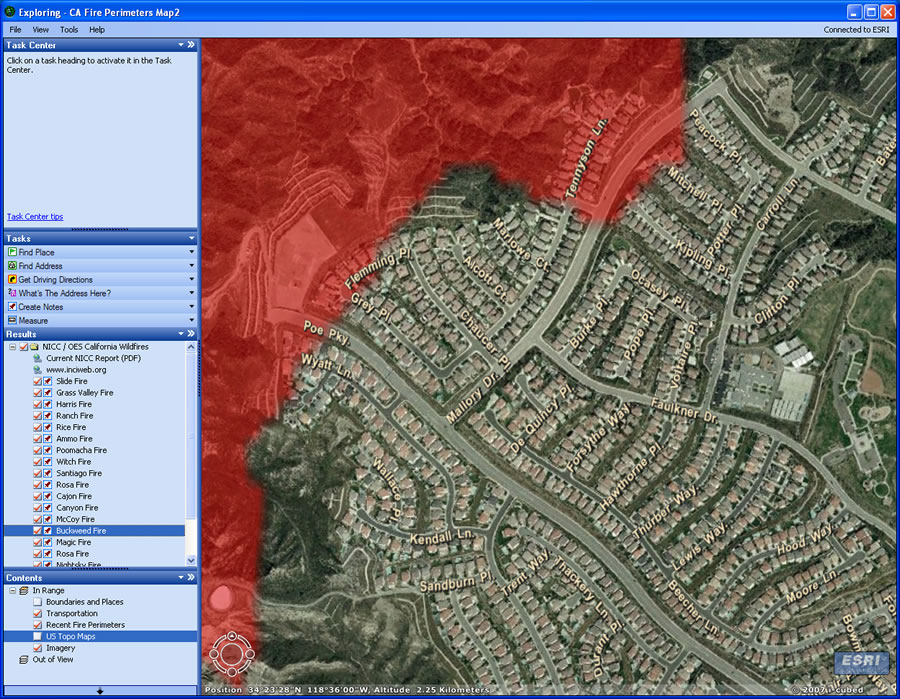 ArcGIS Explorer shown using several services to create a map showing a fire perimeter's encroachment a residential area in San Diego County. The image was creating by fusing detailed imagery, streets and street names, and a fire perimeter. |
Similar to previous efforts for the Zaca fire near Santa Barbara, California, as well as the large-scale California fires of 2003, Esri provided staffing, ArcGIS software, and other resources. More than a dozen wildfires in Los Angeles, Orange, Riverside, San Bernardino, San Diego, and Ventura counties burned hundreds of thousands of acres, destroyed thousands of homes, and left half a million people at least temporarily displaced.
"As soon as the very first fire began, firefighters, emergency services, law enforcement, health professionals, and numerous others have worked diligently around the clock to respond to the fires and to help those in need," Russ Johnson, public safety solutions manager for Esri, said during the fires. "Federal, state, and local government agencies worked effectively in a coordinated, optimized fashion, and GIS professionals played a key role. Esri assisted these professionals and the responding agencies in any way we could by supplying staff, expertise, GIS technology, and other resources."
GIS was used at each incident command post as well as at multiple command centers including Southern California operations centers and the Federal Emergency Management Agency (FEMA) joint operations center in Pasadena. Esri's GIS specialists who were on-site at these locations provided map production support, analysis, data acquisition, and technical support.
Esri also made available a highly intuitive, free GIS application for viewing a wealth of digital fire perimeter and related map information. The application, built using ArcGIS Explorer, enabled interested parties to see fire perimeters in 3D linked to the InciWeb site. The InciWeb site provided detailed tabular data on the status of fires such as containment, personnel and equipment assigned, control progress, evacuations, and road closures. GIS provides an integrated common operational picture for comprehensive, map-based situational awareness. Agency personnel took advantage of the analysis and visualization capabilities to help federal, state, and local agencies collaborate, prioritize, and best utilize manpower and resources as well as monitor events on the ground in near real time.
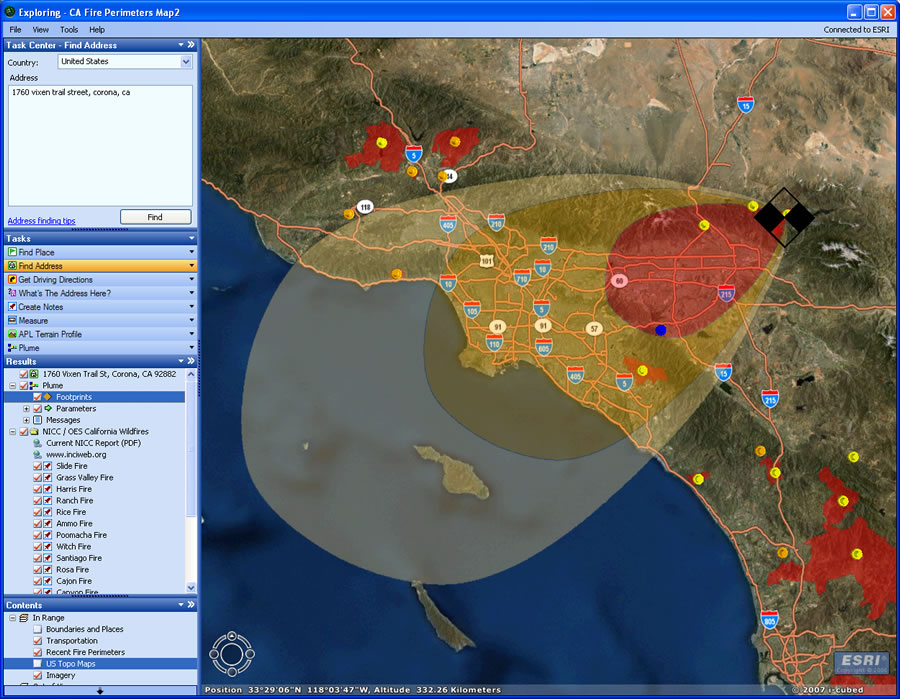 ArcGIS Explorer shown displaying the results of a plume model showing the potential dispersal of smoke and particulate matter from the fires based on wind velocity, wind direction, and duration. |
Staff used GIS to integrate fire perimeter data with near real-time satellite heat signatures to provide a reasonable picture of fire growth. Real-time weather (wind) was incorporated to provide an indication of what direction and at what speed the fire would travel. This information, when coupled with GIS layers that located homes and other developments in harm's way, provided fire officials with better information to make tactical and strategic decisions concerning public safety, resource allocation, evacuation needs, and additional equipment needed. Some of the other emergency applications for which ArcGIS software was used included identifying critical facilities and infrastructure, performing property and community damage assessments, selecting locations for placing disaster relief centers, carrying out evacuations, and developing recovery plans.
Software and extensions used included ArcGIS with ArcEditor for data editing, ArcGIS Spatial Analyst, and the Wildfire Community Extension Fire Incident Mapping Tools (FIMT) for producing maps that included all of the incident command system (ICS) symbology for fire operations personnel. ArcGIS Explorer was used to provide 3D views of the fires and parcels that had been impacted by the fires. Specialists used GIS to analyze vegetation, slope, and other landscape features to help understand and potentially predict fire behavior in the event weather conditions worsened.
Public information professionals used GIS to answer questions about where the fires were located, which roads were closed, which communities were being evacuated, where shelters were located, and where property had burned. Government officials turned to Web GIS mapping services to coordinate, with other agencies, strategies and tactics to fight the fires and to share information with constituents and the media.
Free California Fires Service Available
Users can access the California fire application via the ArcGIS Explorer Resource Center. From ArcGIS Explorer, simply choose File, then Resource Center, and select the California Fires map in the lower right.
The California Fires application still shows the perimeters and locations of where the fires in southern California burned. The map includes a collection of results that can be clicked to navigate to each fire area. Clicking the result pushpin will open a direct connection to the InciWeb site (if an entry is available) for the latest fire status, news, maps, and other information.
More Information
For more information, contact Russ Johnson, Esri Public Safety Industry Manager (e-mail: russ_johnson@esri.com).