Oak Glen 3 Fire
Where: South of the community of Oak Glen in San Bernardino County, California
Acres burned: 1,159
Date started: August 30, 2009
Pendleton Fire
Where: Yucaipa, a city in San Bernardino County, California
Acres Burned: 860
Date Started: August 31, 2009
Seeing through the Smoke with GIS
By Tom Patterson, Esri Wildland Fire Specialist
As the flames from two wildfires engulfed the hills and canyons near the communities of Oak Glen and Yucaipa, California, the heat was also on three GIS mapping specialists working out of the San Bernardino County Sheriff's Mobile Mapping Unit.
 California Governor Arnold Schwarzenegger speaks at a briefing in Yucaipa on September 1, 2009, where he received status updates about the statewide wildfires. Photo/Tom Patterson, Esri | |
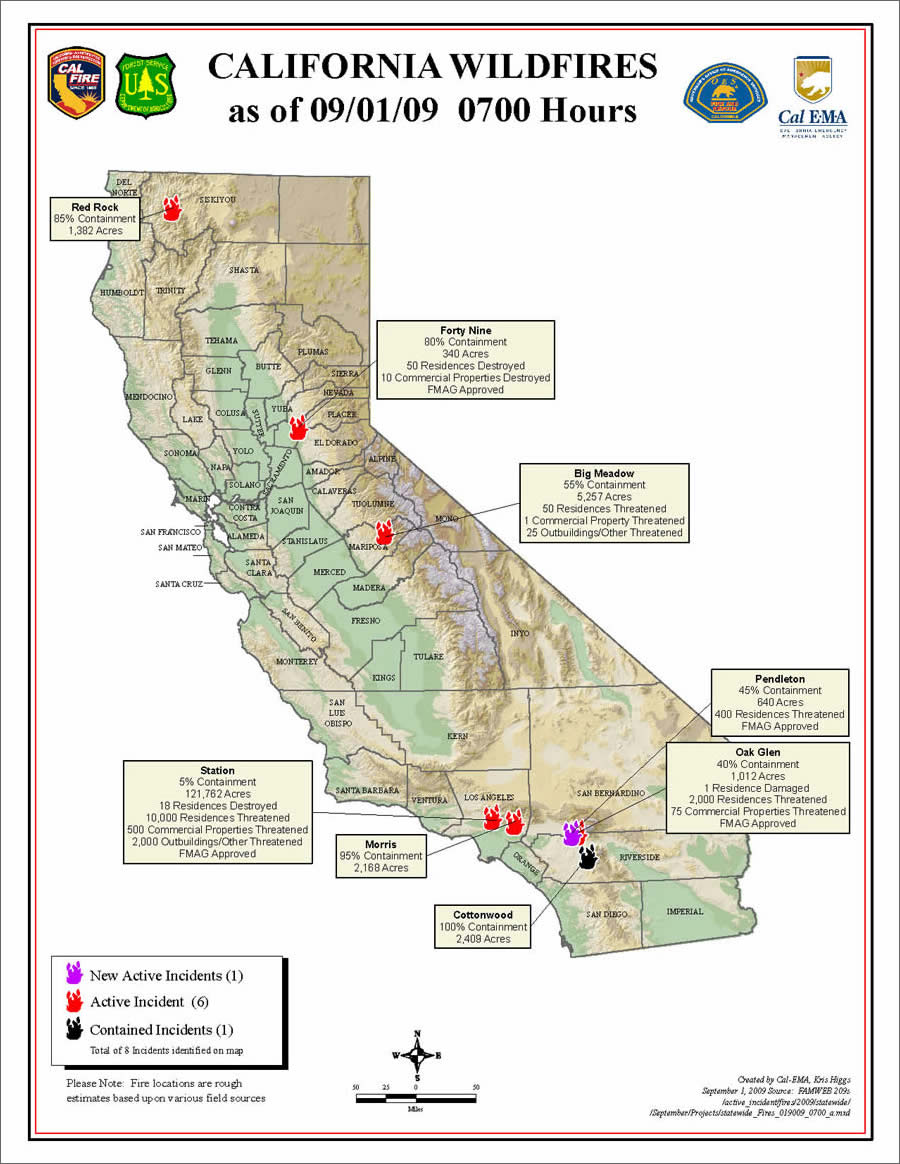 This is the statewide fire map Schwarzenegger received for his briefing. | |
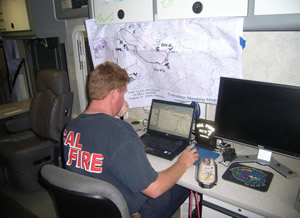 Robert Clark, GIS technical specialist for CAL FIRE, makes the Incident Briefing Map. Photo/Tom Patterson, Esri |
It was just after midnight last September 1, and in less than four and a half hours, this small team needed to create several essential maps for fire officials and firefighters. These maps are used for planning how the fire will be suppressed, coordinating the evacuation of residents, and informing the general public.
The specialists also needed to provide a statewide briefing map that would be used to update Governor Arnold Schwarzenegger about all the fires burning in California. The briefing was scheduled for 9:00 a.m. that day—in less than nine hours—at the fire command post in Yucaipa Regional Park.
The assignment, though a fairly easy one, added to an already heavy workload for GIS technical specialists Robert Clark and Joe Larson and their supervisor Jonathan Pangburn, the lead GIS technical specialist for Team 7 of the California Department of Forestry and Fire Protection (CAL FIRE).
The GIS staff had arrived at the park late on August 31 and set up shop inside the Mobile Mapping Unit, a 40-foot converted recreational vehicle that contains two GIS workstations, a large-format printer, and a satellite receiver for Internet access.
GIS teams normally spend the entire first shift just playing catch-up and producing commonly used maps called the "Big Five"-Situation-Plans Map, Transportation Map, Incident Action Plan Map, Progression Map, and Incident (Operations) Briefing Map. Optional map products can include the Ownership-Land Status Map, Aerial Operation Map, and Damage Assessment Map. (See a complete description of the maps and target audiences.) The GIS team also needed to create large information maps for office walls and information kiosks plus smaller maps for briefing packets. The additional request for a map showing all current California wildfires, made by a high-ranking CAL FIRE official, threw a bit of a wrench into the workflow. That map would show the locations and summarize the status of all active fires. Additionally, a separate report would need to be provided for the briefing that would include weather forecasts and any Red Flag warnings. Red Flag warnings are issued by the National Weather Service to inform firefighting and land management agencies that ideal conditions exist for a wildfire.
GIS Makes Creating a Map for a High-Level Briefing Easy
The power of GIS technology really comes into play in a highly intense, deadline-driven environment. Last-minute schedule changes can be accommodated fairly easily. Pangburn decided to order the map for the governor's visit from the California Emergency Management Agency (Cal EMA). There was no need to start from scratch. Pangburn simply called the duty officer at Cal EMA in Sacramento and requested an updated statewide fire status map based on the one used August 30, when the governor visited the command post for the Station Fire, which burned 160,557 acres in the Angeles National Forest.
During fire briefings, politicians want an assessment of what is at risk. They need answers to questions such as What are property values in the area that's burning? How many people will be affected by the fire? How many businesses will be impacted? and What infrastructure (e.g.,utilities, roads, bridges, power lines, and communication sites) could be destroyed, damaged, or affected? They also want to know how fast the fire is moving, what areas have been evacuated, and how long the evacuations are expected to last. GIS technology can give government officials the answers to these questions and others. The base data and fire incident data needed to supply the answers resides on state and national FTP sites and servers. This makes it easy for authorized personnel to create and share a map for different purposes and various audiences.
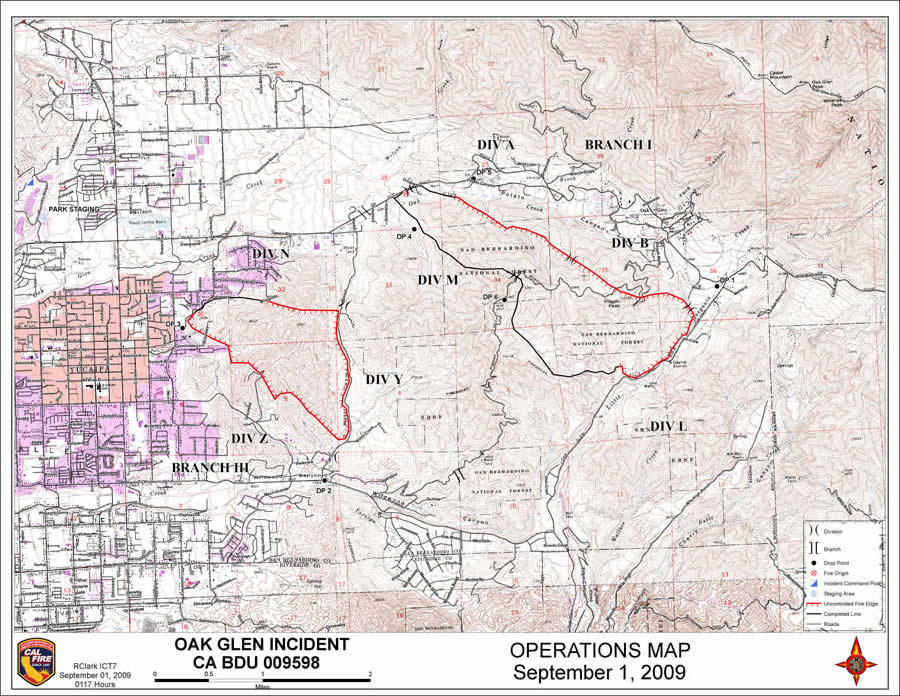 An example of an Incident Briefing Map, also known as an Operations Map. |
The Cal EMA employee who makes the status maps was off duty until 7:30 a.m., but Pangburn knew that using GIS, there would be a quick turnaround. It would take only minutes to update the statewide fire briefing map with data that would include the name and current size of each fire, the percentage of containment, and the number of residences and commercial buildings destroyed or threatened.
Pangburn requested that the map be delivered via e-mail by about 8:00 a.m. He could have also had the Cal EMA employee post the map at Esri's ArcGIS Online (www.arcgisonline.com). ArcGIS Online is a Web-based repository that lets users share maps and other geographic content 24/7. All team members in Yucaipa could have downloaded the map document. Clicking on the file would automatically open it in ArcGIS Desktop, ready to print.
Attention Turns to Making Other Maps
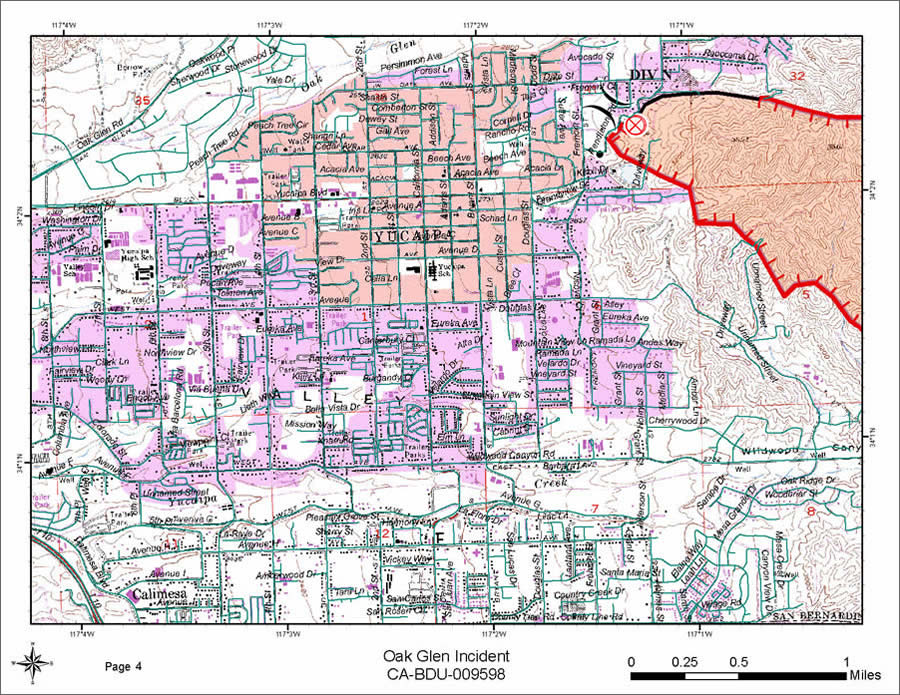 An example of an IAP Map for the Oak Glen 3 fire. | |
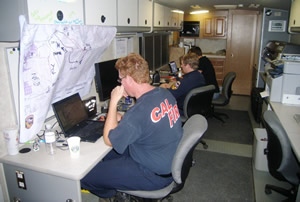 Robert Clark, Jonathan Pangburn, and Joe Larson, all GIS technical specialists for CAL FIRE, worked through the night to make maps for the firefighters. Photo/Tom Patterson, Esri |
While waiting for the governor's briefing map to arrive, Pangburn and his team turned their attention to the other maps they needed to make for the firefighters and emergency personnel.
The team's priority was to create the large Incident Briefing Map, which the governor would also view. The map is commonly used to describe to firefighters their tactical assignments and objectives just before they leave for the fire lines. It is usually a huge paper map that is mounted to a 4- by 8-foot sheet of plywood. Personnel can clearly see their geographic area of responsibility and the locations of homes, cultural resources, endangered species habitats, facilities, and historic structures that they need to protect. The map also shows other relevant sites like water sources, transportation routes, and staging areas.
Smaller 8�- by 11-inch maps are attached to the Incident Action Plan (IAP), which documents the goals of the firefighting efforts. These small maps contain the same information as the Incident Briefing Map, along with topographic features such as contour lines, ridgelines, mountain peaks, and streams. Data specific to the incident also appears on the map and may include division boundaries, drop points, helispots, safety zones, and the last known fire perimeter depicting the fire line segments where the blaze is controlled or uncontrolled.
Firefighters make corrections to the IAP Map using annotations. These updates can also be recorded by field observers using mobile GIS on handheld PDAs with built-in GPS and wireless communications. At the end of the shift, all this new information is analyzed in the GIS unit where the GIS technical specialists use it to make modifications to the next Incident Briefing Map.
The Progression Map is the most useful for documenting the fires and understanding fire behavior. Depending upon its complexity, a wildfire can be mapped several times a day by GPS reconnaissance helicopter overflights, remote sensing, or field observers hiking the fire line using a paper map and compass. The results from these fire perimeter data collections can be converted into GIS layers symbolized by cool to warm colors and used to show how the fire spreads by size, date, and time. When mapping a fuel and topography-driven fire such as the Oak Glen/Pendleton fires, these layers can be draped over 3D shaded relief features. For people viewing the map, it's a strong visual.
Benefits of GIS
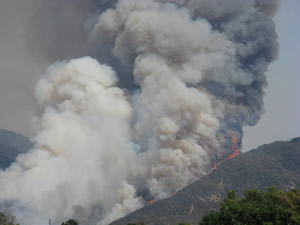 The Pendleton Fire threatens Oak Glen, California. Photo/Lew Nelson, Esri | |
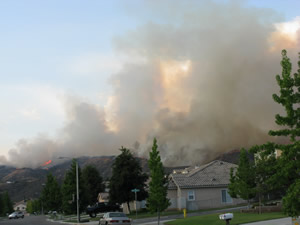 The Pendleton Fire sends smoke billowing over a Yucaipa neighborhood. Photo/Lew Nelson, Esri | |
 This map shows how the Oak Glen 3 fire progressed by date. |
Geospatial technology gives everyone involved in the fire suppression effort useful maps, whether it's an overview map for the politicians or a detailed tactical map for the firefighters. "GIS allows a familiar display of geospatial data with recognizable symbology while maintaining a digital archive for future reference," Pangburn said.
The team, he added, must work quickly. "The objective is to create a clear product that is useful to the end user. In that respect, I believe we were quite successful on the first night. Within nine hours, we created a well-defined data structure with base data, an incident-specific geodatabase, and multiple map products. The personnel in the field are always the top priority, but we certainly make a concerted effort to accommodate all map requests, especially when they are placed by VIPs."
After the 7:00 a.m. briefing to the day shift crews, the additional maps and weather documents were printed and displayed with 30 minutes to spare before the governor arrived at Yucaipa Regional Park. Schwarzenegger reviewed the statewide fire briefing map created using GIS while praising the firefighters for their hard work in saving the homes that were threatened.
Schwarzenegger supports geospatial technology and understands its value. He touted GIS during a technology conference last year. At his direction, California chief information officer Teri Takai created a Geospatial Information Systems Task Force. This group is charged with expanding the use of the technology in many areas of government, including public safety.
"During last year's firestorms, GIS helped firefighters to see through the smoke, giving them a powerful tool to fight the blaze," said Schwarzenegger in a press release issued by Takai's office. "This is just one example of a technology that we must tap further into and coordinate throughout the federal, state, and local governments. California has a proud tradition of being an innovator and leading the development of technologies. We must keep pushing forward to build new applications that will better serve the people of California."
Watch the video of Schwarzenegger talking about the value of GIS.