Save Time with Graphs
 To create a Graph Template, right-click on the graph window and export the file as a .tee file, the native format for ArcGIS graphs. |
Graphs are a great way to show additional information about features in a map or display the same information in a different way. Once you get a graph just the way you want it, you can save it as a Graph Template so you can quickly generate additional graphs with the same characteristics from different datasets that have a similar structure.
Graph Templates are saved as .tee files, the native format for ArcGIS graphs. These text files contain all the information necessary to re-create a graph with the same style, fonts, legends, and labels using other data layers or tables.
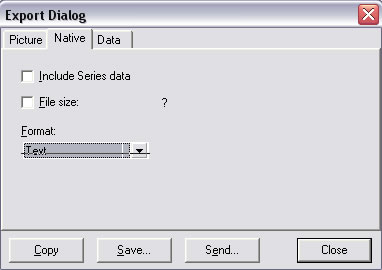
When you have made all adjustments to your graph, right-click on the graph window and choose Export. In the Export dialog box, click the Native tab. On that tab, uncheck the boxes next to Include Series data and File size control. In the dropdown, set Format to Text. Click the Save button and navigate to the location where Graph Templates are stored on your machine. Name the new Graph Template and click Save. ArcGIS Desktop stores Graph Templates in one of two places:
Or
C:\Documents and Settings\
Name the new Graph Template and click Save. Click Close when finished.
 Save the Graph Template in the default location so it will be available. Unless you create a custom icon, ArcGIS will assign this default icon. |
ArcGIS automatically gives your Graph Template a standard graphic. To make your Graphic Template easier to locate, you can apply a custom graphic to your template. In a graphics program, create a 42 x 42 pixel BMP image with a white background. Save the icon file with the same name as your template (.tee) file and store it with your template.
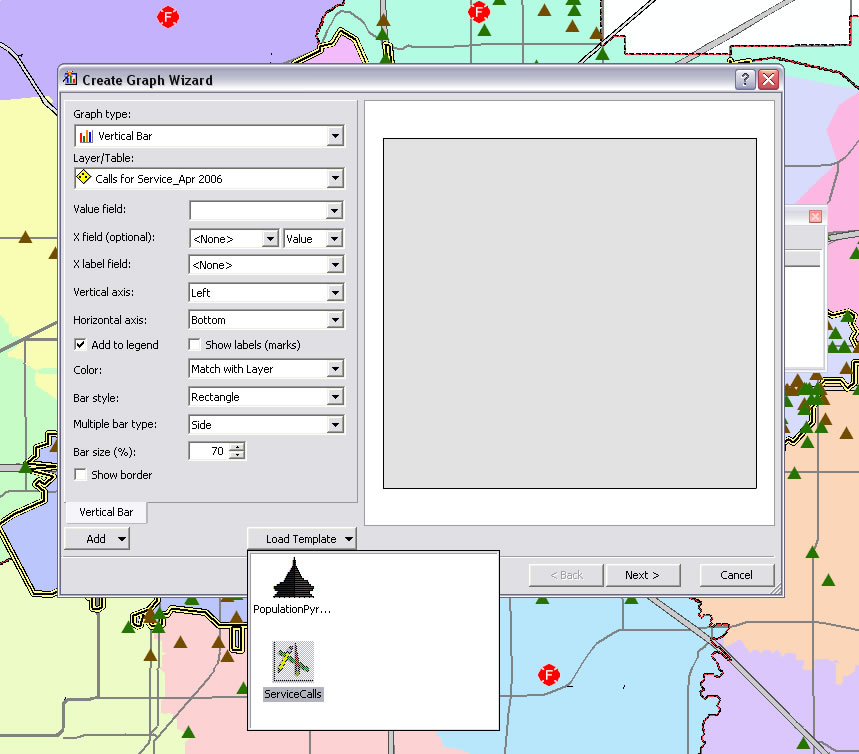
To use your template, select one of the layers or tables that will be used in graph and choose Tools > Create Graph from the Standard toolbar. In the Graph Wizard, click the Load Template and select the Graph Template you just created from the dialog box. Change dataset references and modify the legend labels to reflect the new datasets being used.